Precise default
Clean figure view
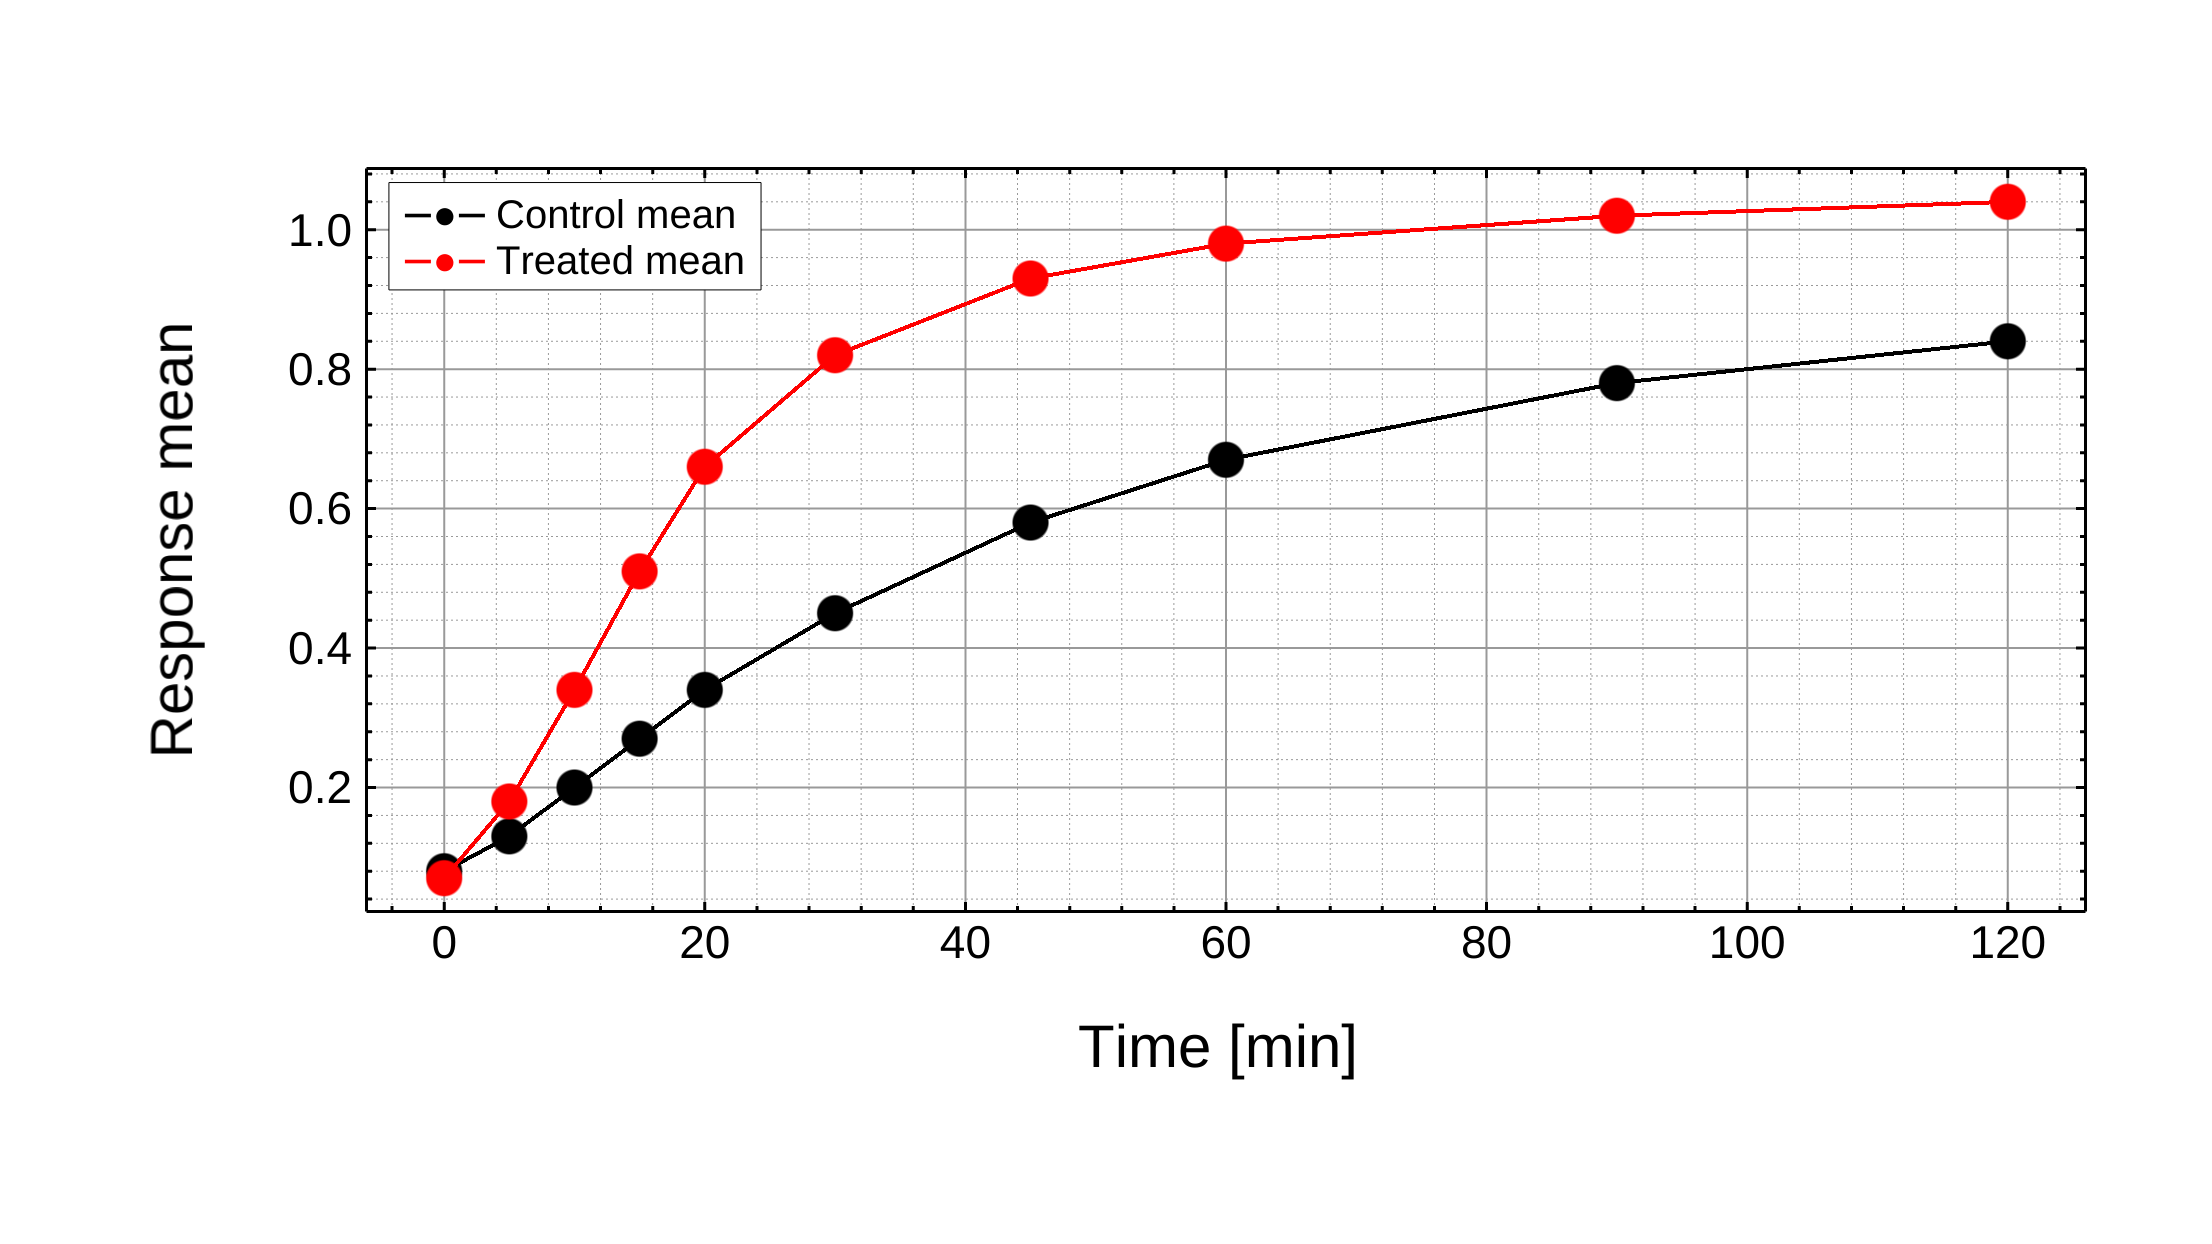
A standard chart style for reports, paper drafts, and routine data checks.
Import CSV, TSV, or Excel data, map X/Y/error columns, edit axes and labels directly, and export high-resolution PNGs. Precise mode is the default; hand-drawn, milkyway, and sparse constellation are optional looks to try for teaching, talks, or public-facing material.
figgy starts with a conventional scientific chart. Render styles are opt-in alternate looks over the same underlying data, not a promise about how a chart will be received.
Drag in CSV, TSV, or an Excel workbook and it opens as an editable sheet — every tab included, with X, Y and ±error columns guessed for you. Fix a value in the table and the chart follows.
Precise mode stays the default. Hand-drawn, milkyway, and sparse constellation are alternate looks you can compare when a chart is headed for teaching material, a talk, or public-facing context.
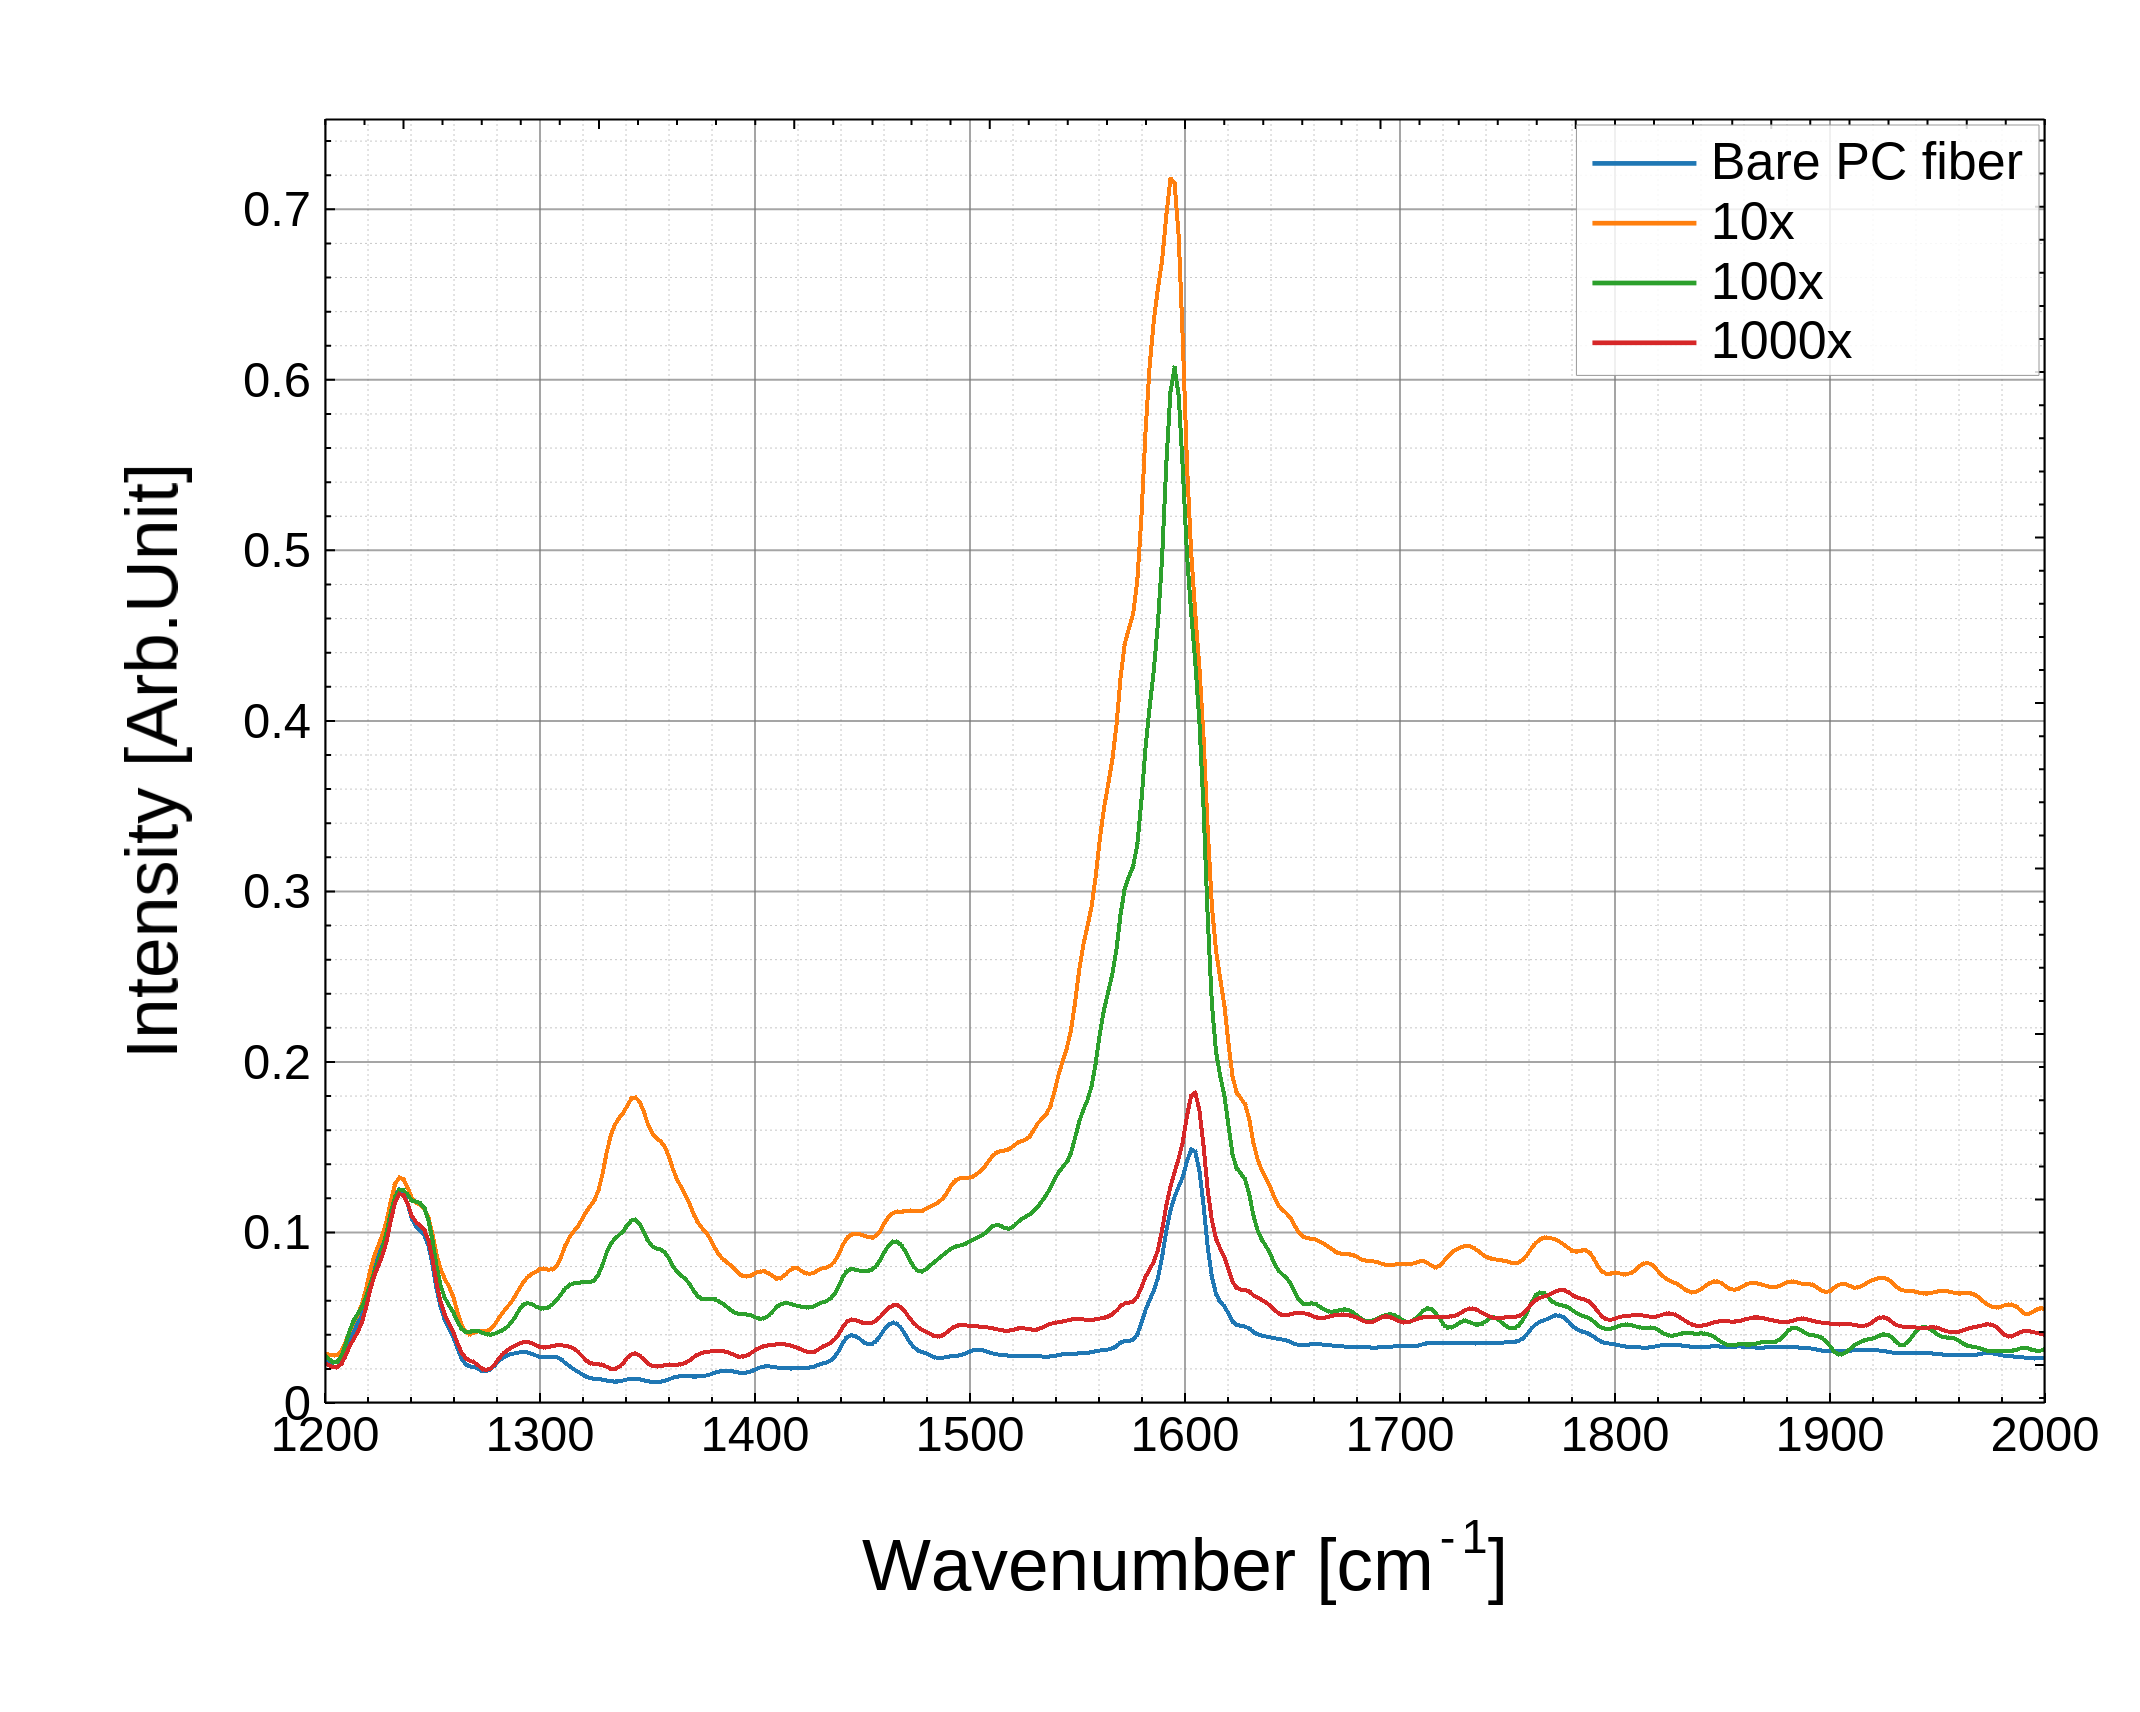
Error bars (X, Y, or both), logarithmic axes, scientific notation and 10ⁿ tick labels, Greek letters, subscripts and superscripts — ΔG‡, x₀, cm⁻¹ — anywhere text appears.
Click an axis to set its range. Click a label to restyle it. Drag the title or legend where you want it. No hunting through menus to find which setting controls which part of the figure.
figgy uses a Rust + WebGPU renderer in modern desktop browsers. The same engine draws precise and alternate styles; they are not decoration layered over a screenshot.
Export high-resolution PNGs at 1–4×, or copy the image to your clipboard. For journal submission, check the required pixel size or DPI before export.
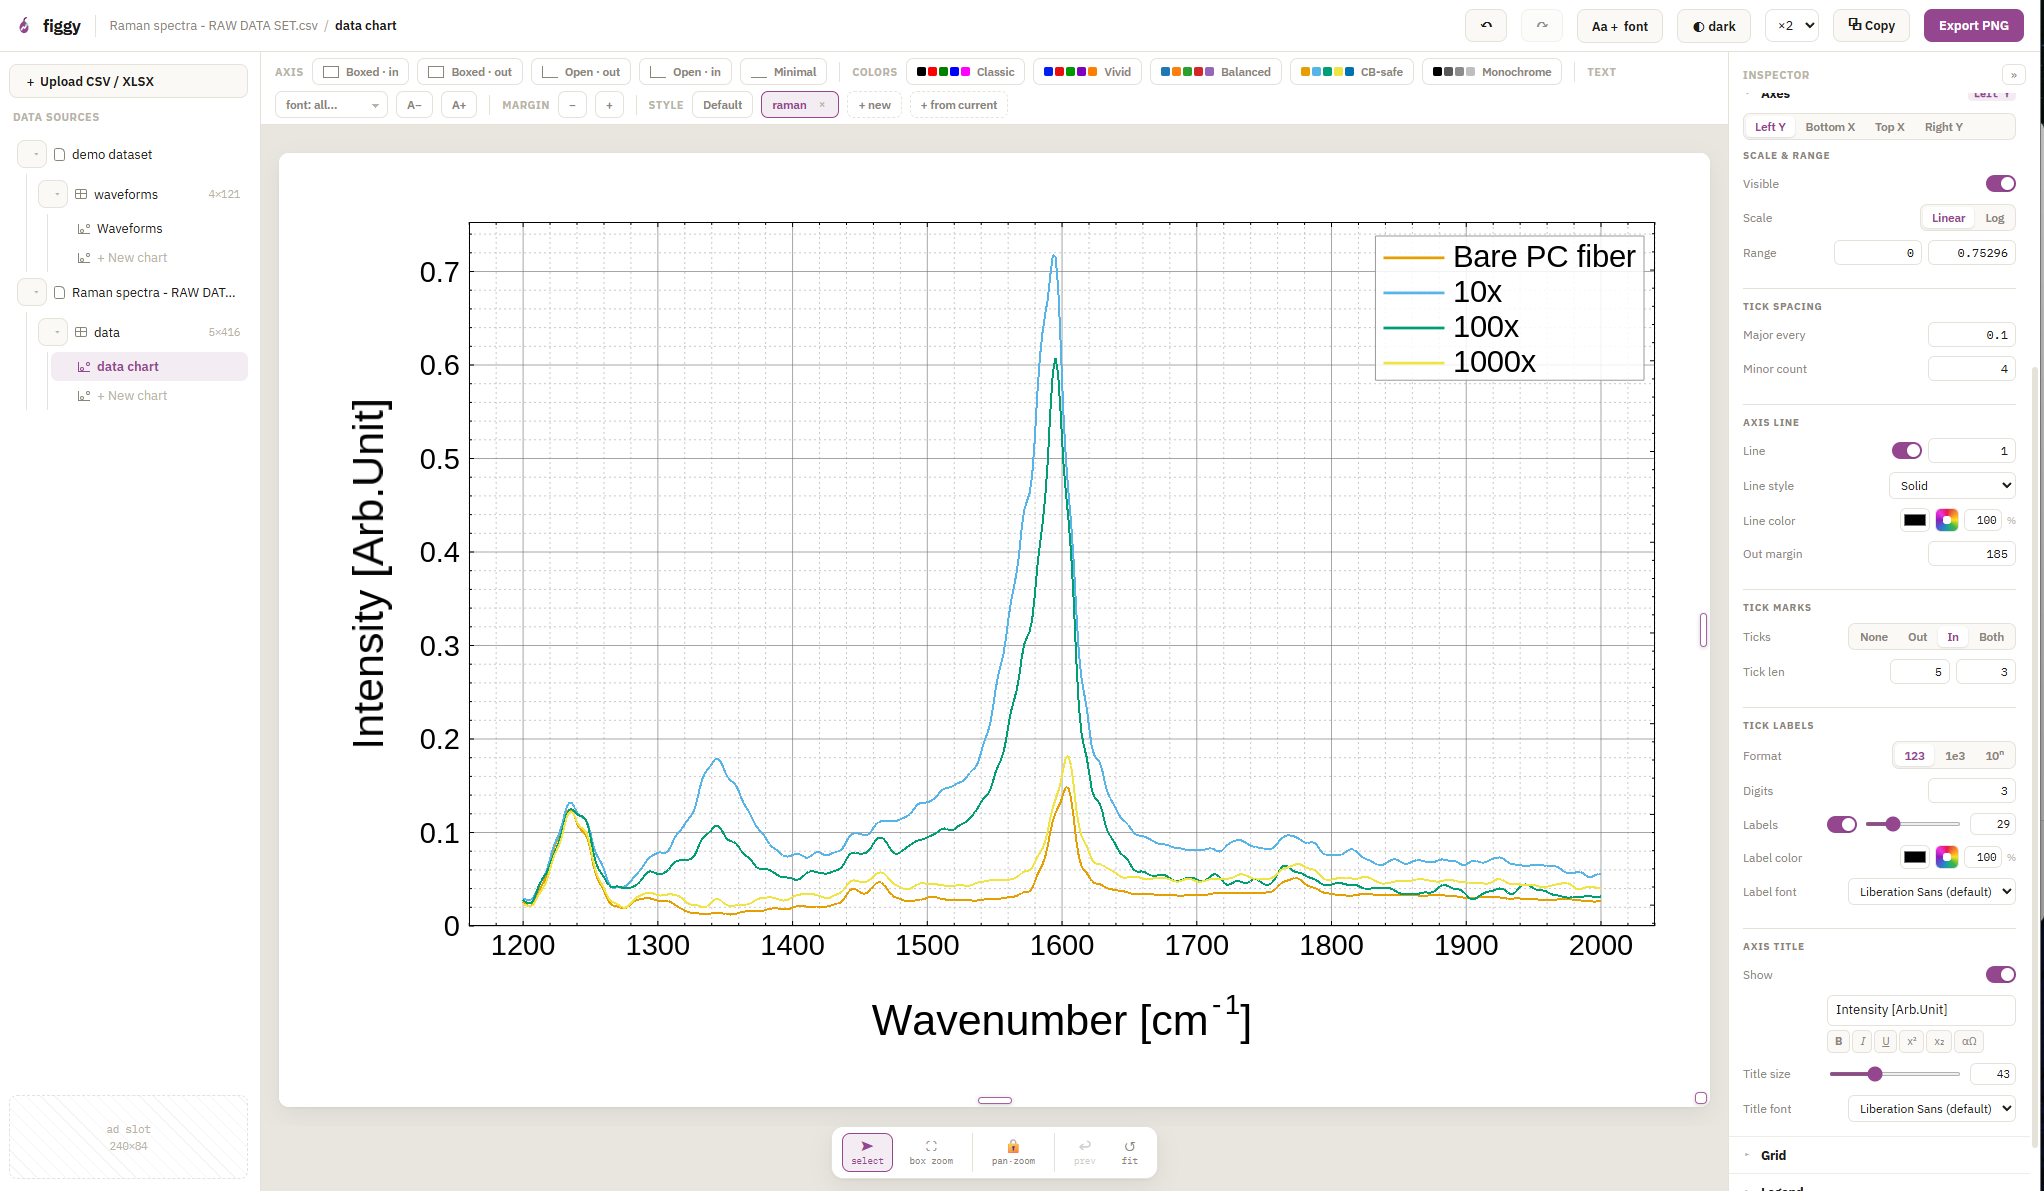
The studio opens your data as a table first, so you can check columns and values before making the chart.
Drag a CSV, TSV, or Excel file onto the page — a workbook brings all its sheets along. Blank sheets are available too, if you want to paste values from another tool.
.csv · .tsv · .xlsx · copy & pasteCheck the sheet, select the X/Y columns you want, and create a chart. figgy guesses common mappings, including nearby error columns, but you can remap them anytime.
X · Y · ±error · row rangeEdit axes, labels, legend, fonts, colors, and optional render styles, then export a PNG sized for your paper, slide, poster, or video workflow.
precise default · optional styles · PNG ×1–×4figgy is MIT-licensed and runs in your browser tab. No trial period, no locked features, no “upgrade to export” — the studio you see here is the whole product.
We build it in the open because real lab data is the best test a charting engine can get. If something breaks on yours, tell us — that's the whole deal.
Your chart data is not uploaded to figgy. Plotting happens client-side, and saved .figgy projects are files you write to your own disk. The site may still load third-party resources such as fonts, ads, and the XLSX parser; the privacy page spells that out.
A few studio states and exported charts. Precise charts stay the default; alternate render styles are shown as optional views over the same data.
A standard chart style for reports, paper drafts, and routine data checks.
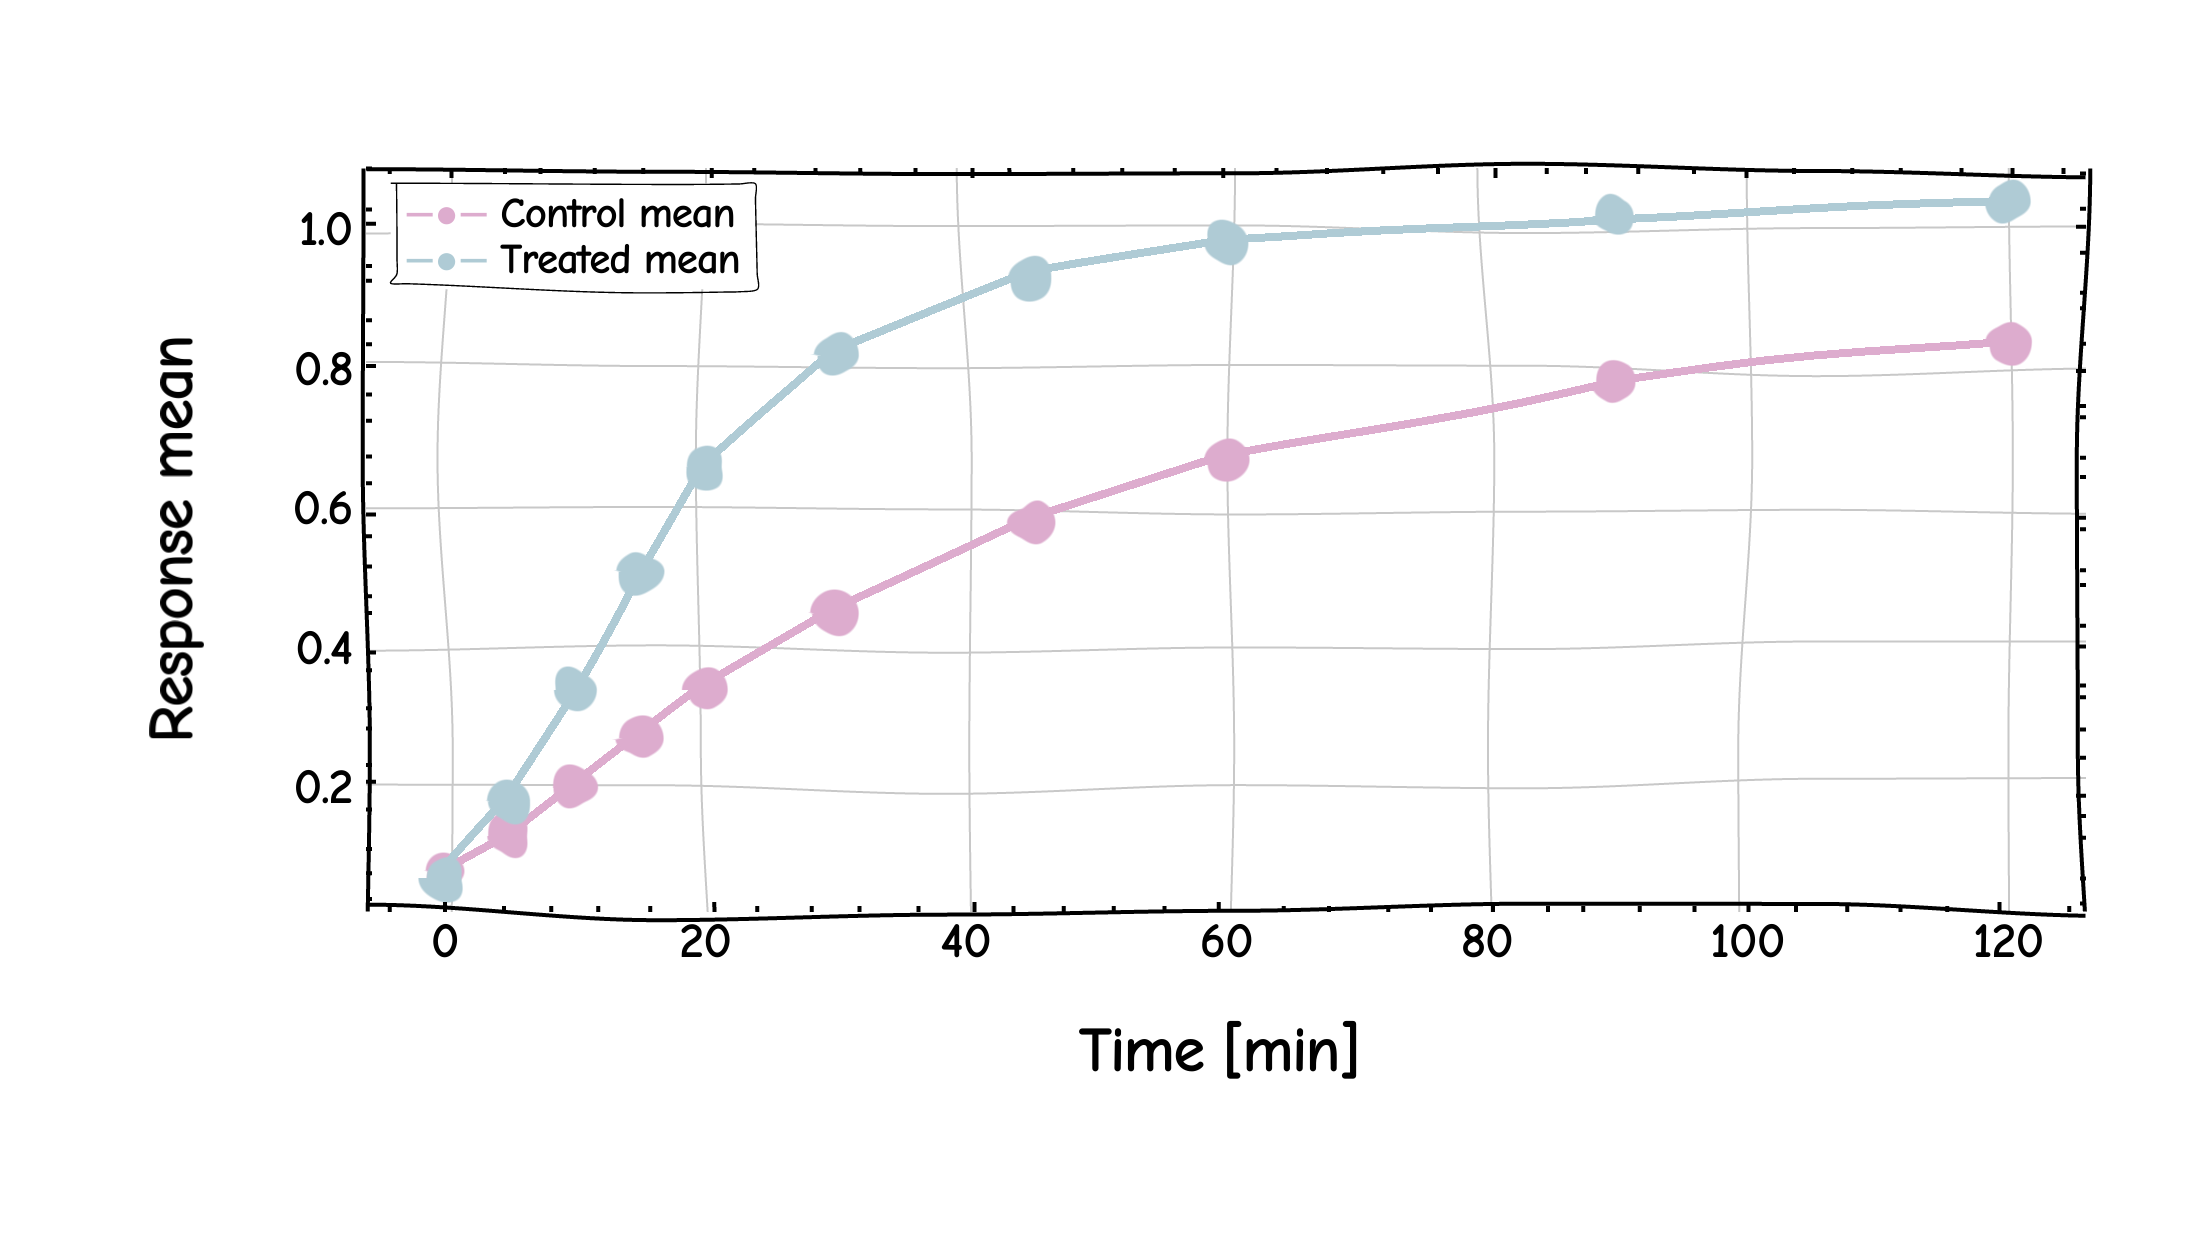
An optional sketch-like rendering for explainers, teaching, and informal slides.
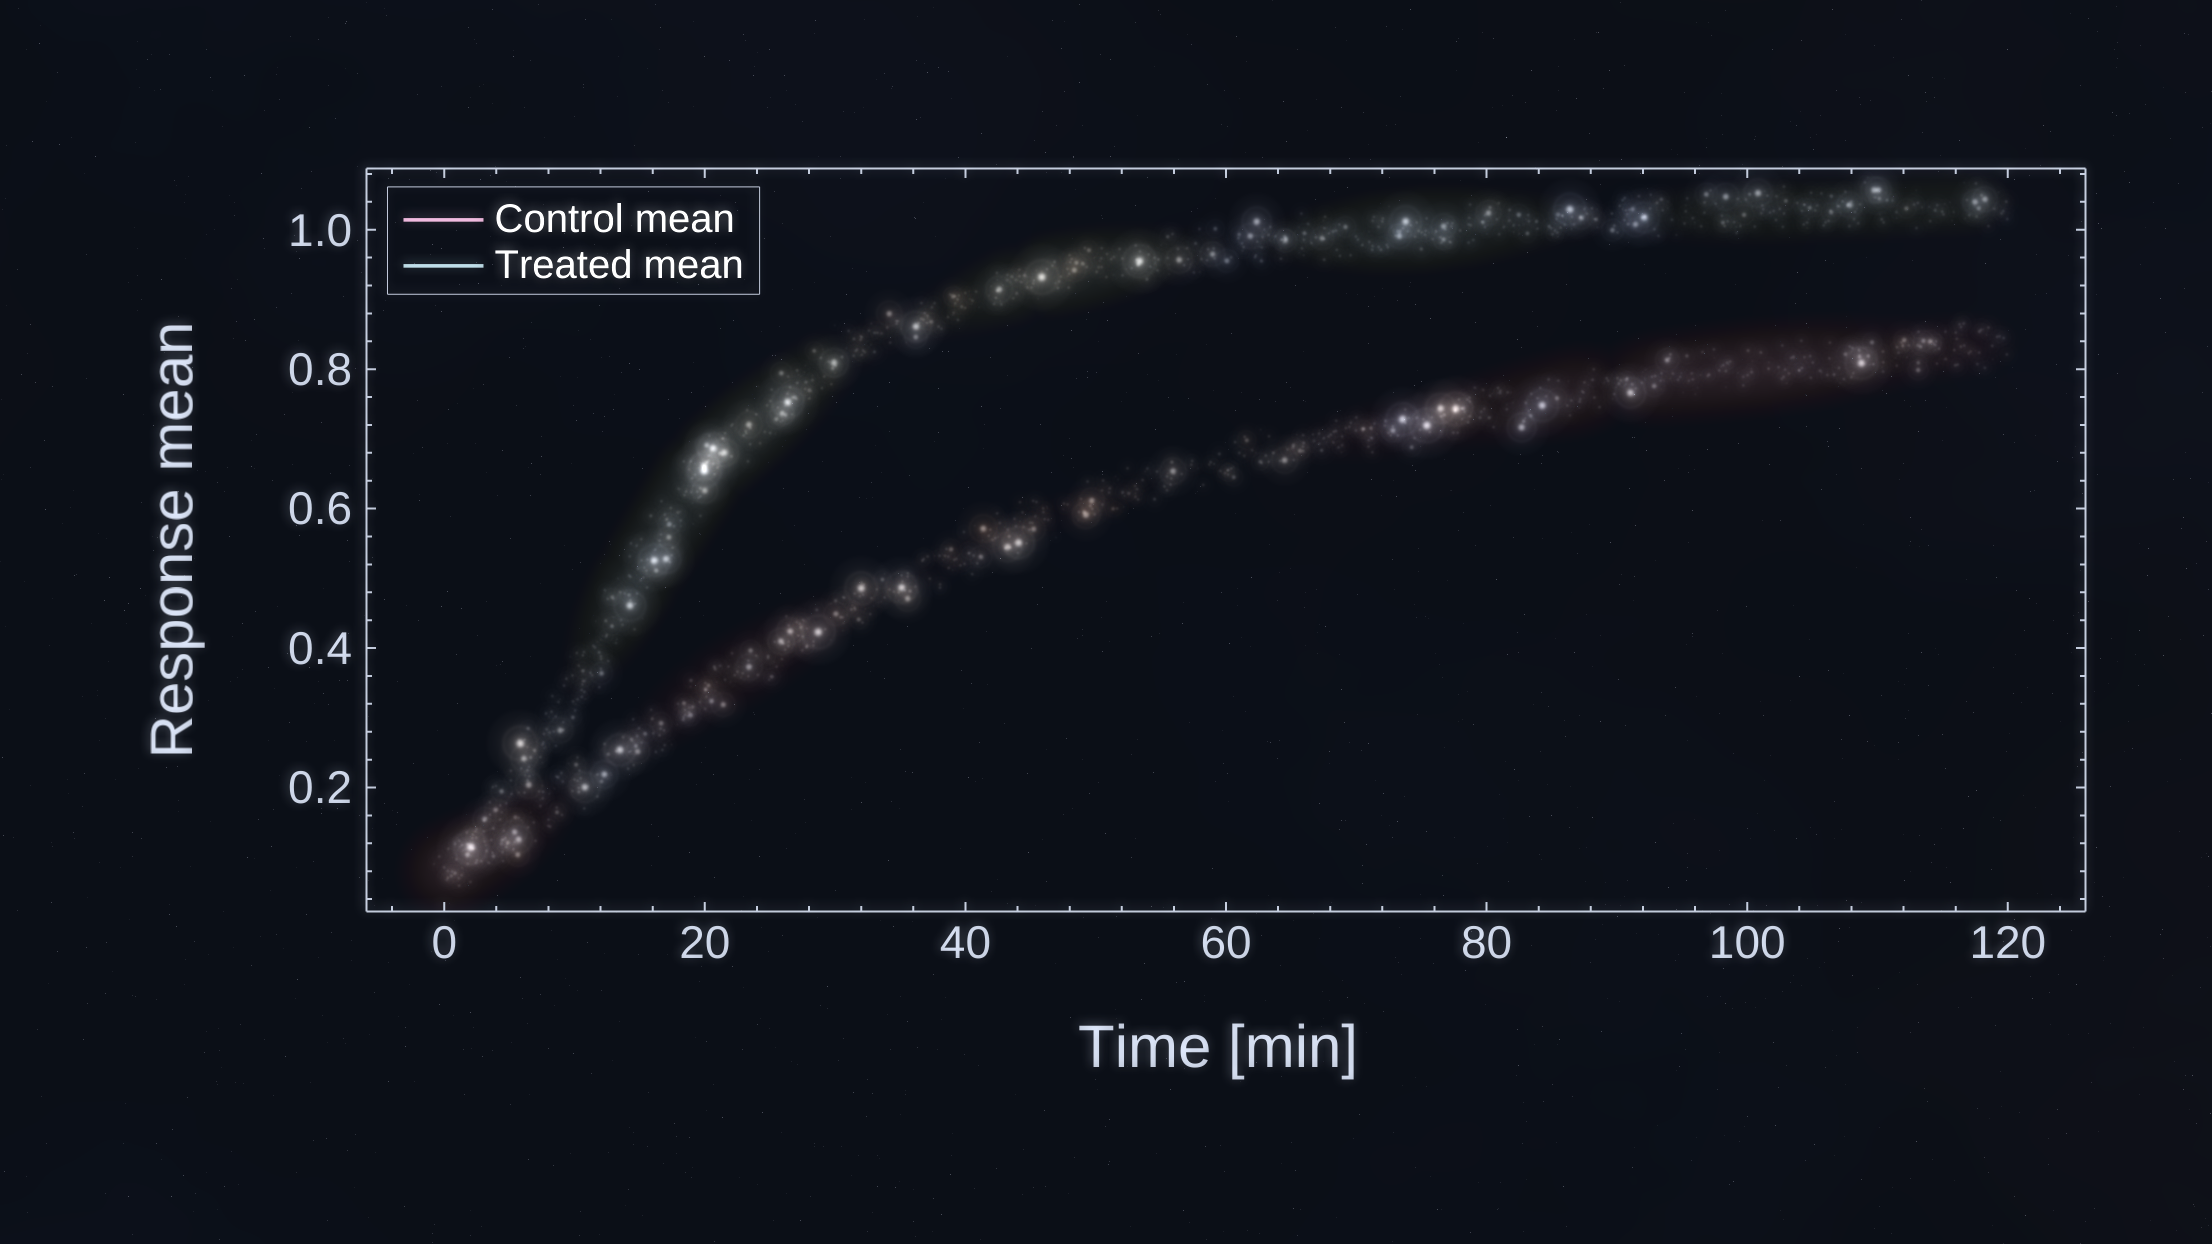
A more expressive export look for talks when a dark chart fits the material.
Exports preserve the chart composition you prepared in the studio, with scale choices for higher-resolution output.
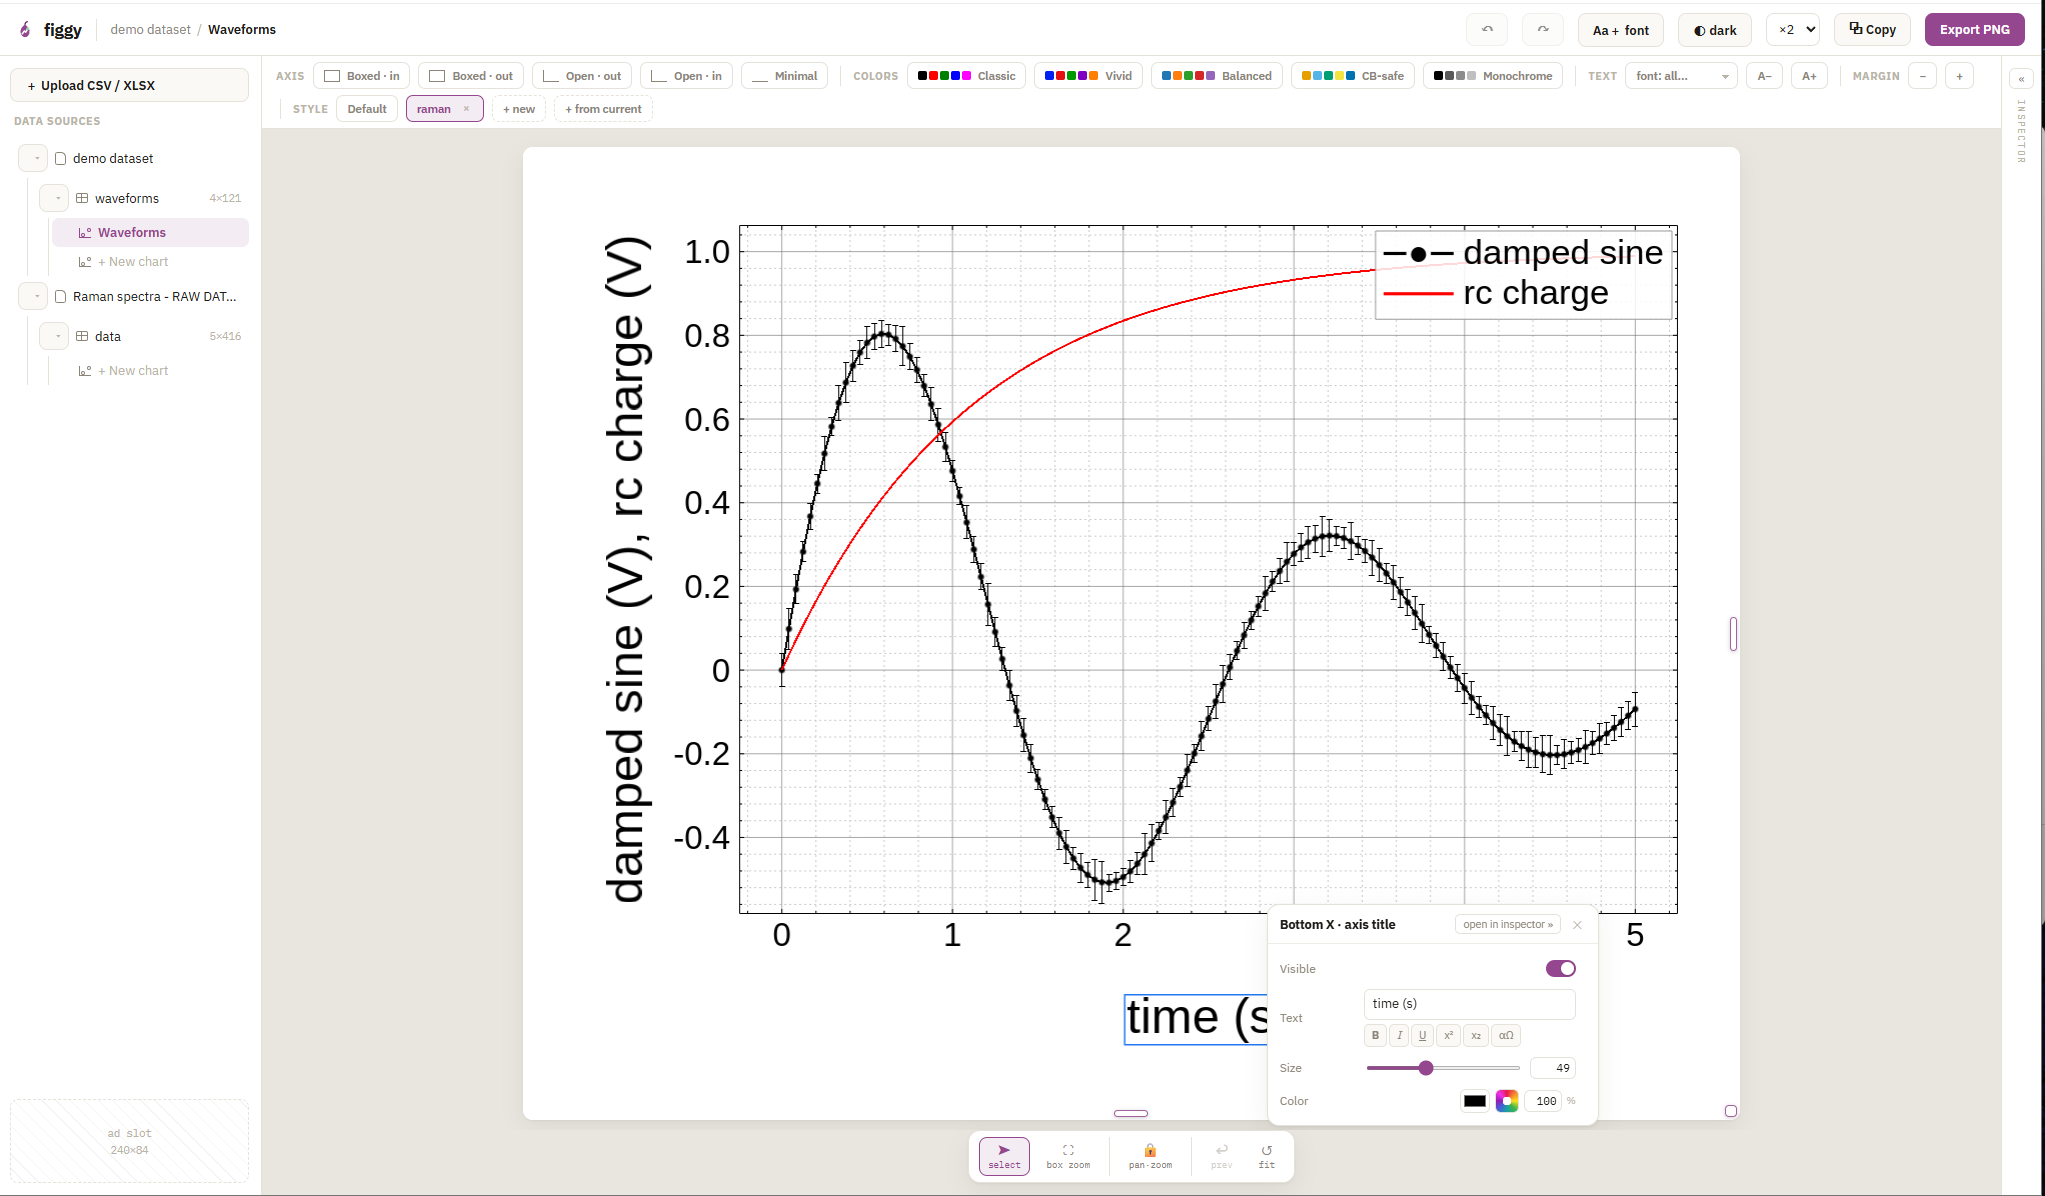
Axes, labels, titles, and legends open the controls for the thing you selected.
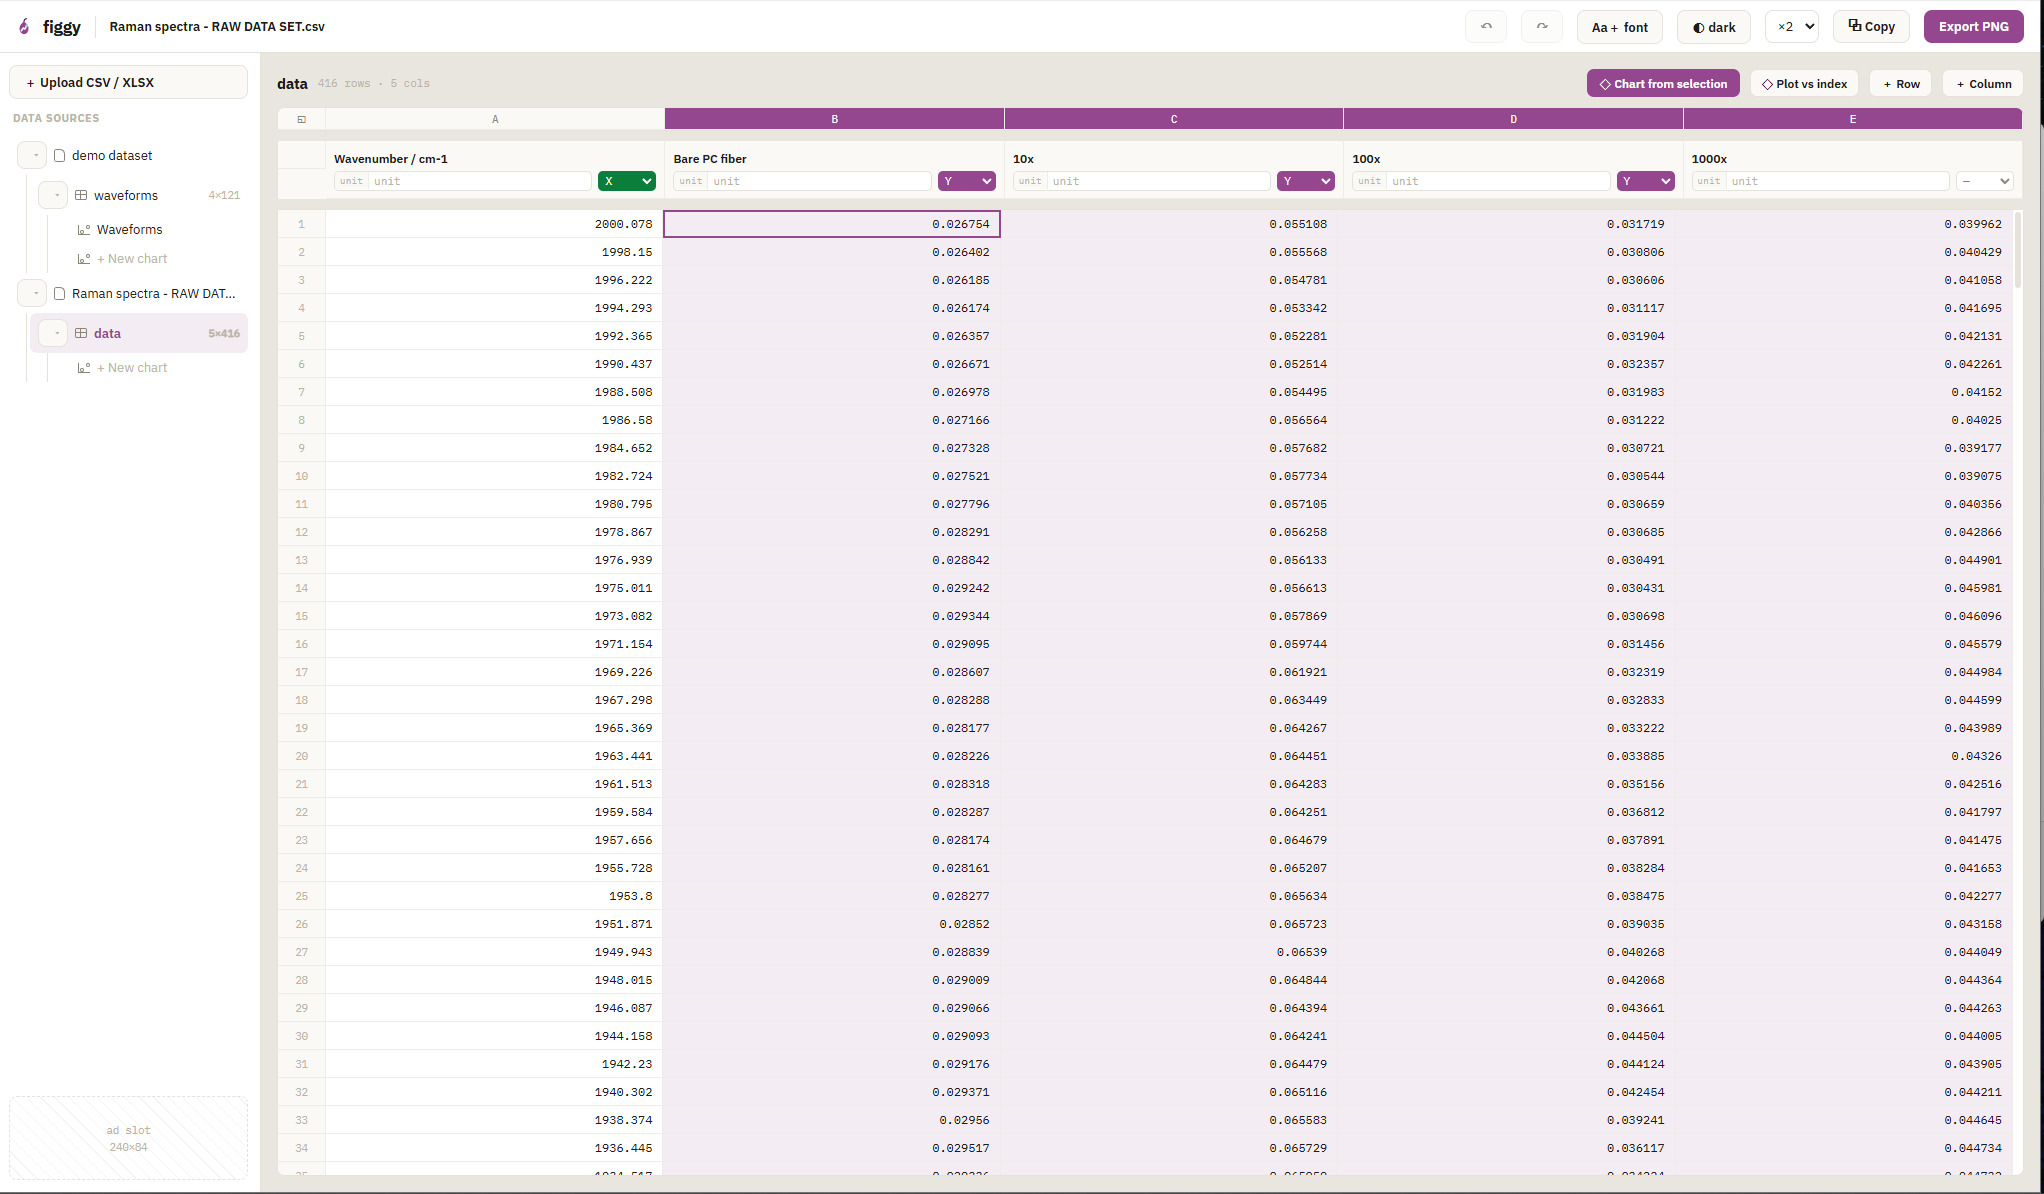
Open a file, check the sheet, then map X, Y, and error columns into a chart.
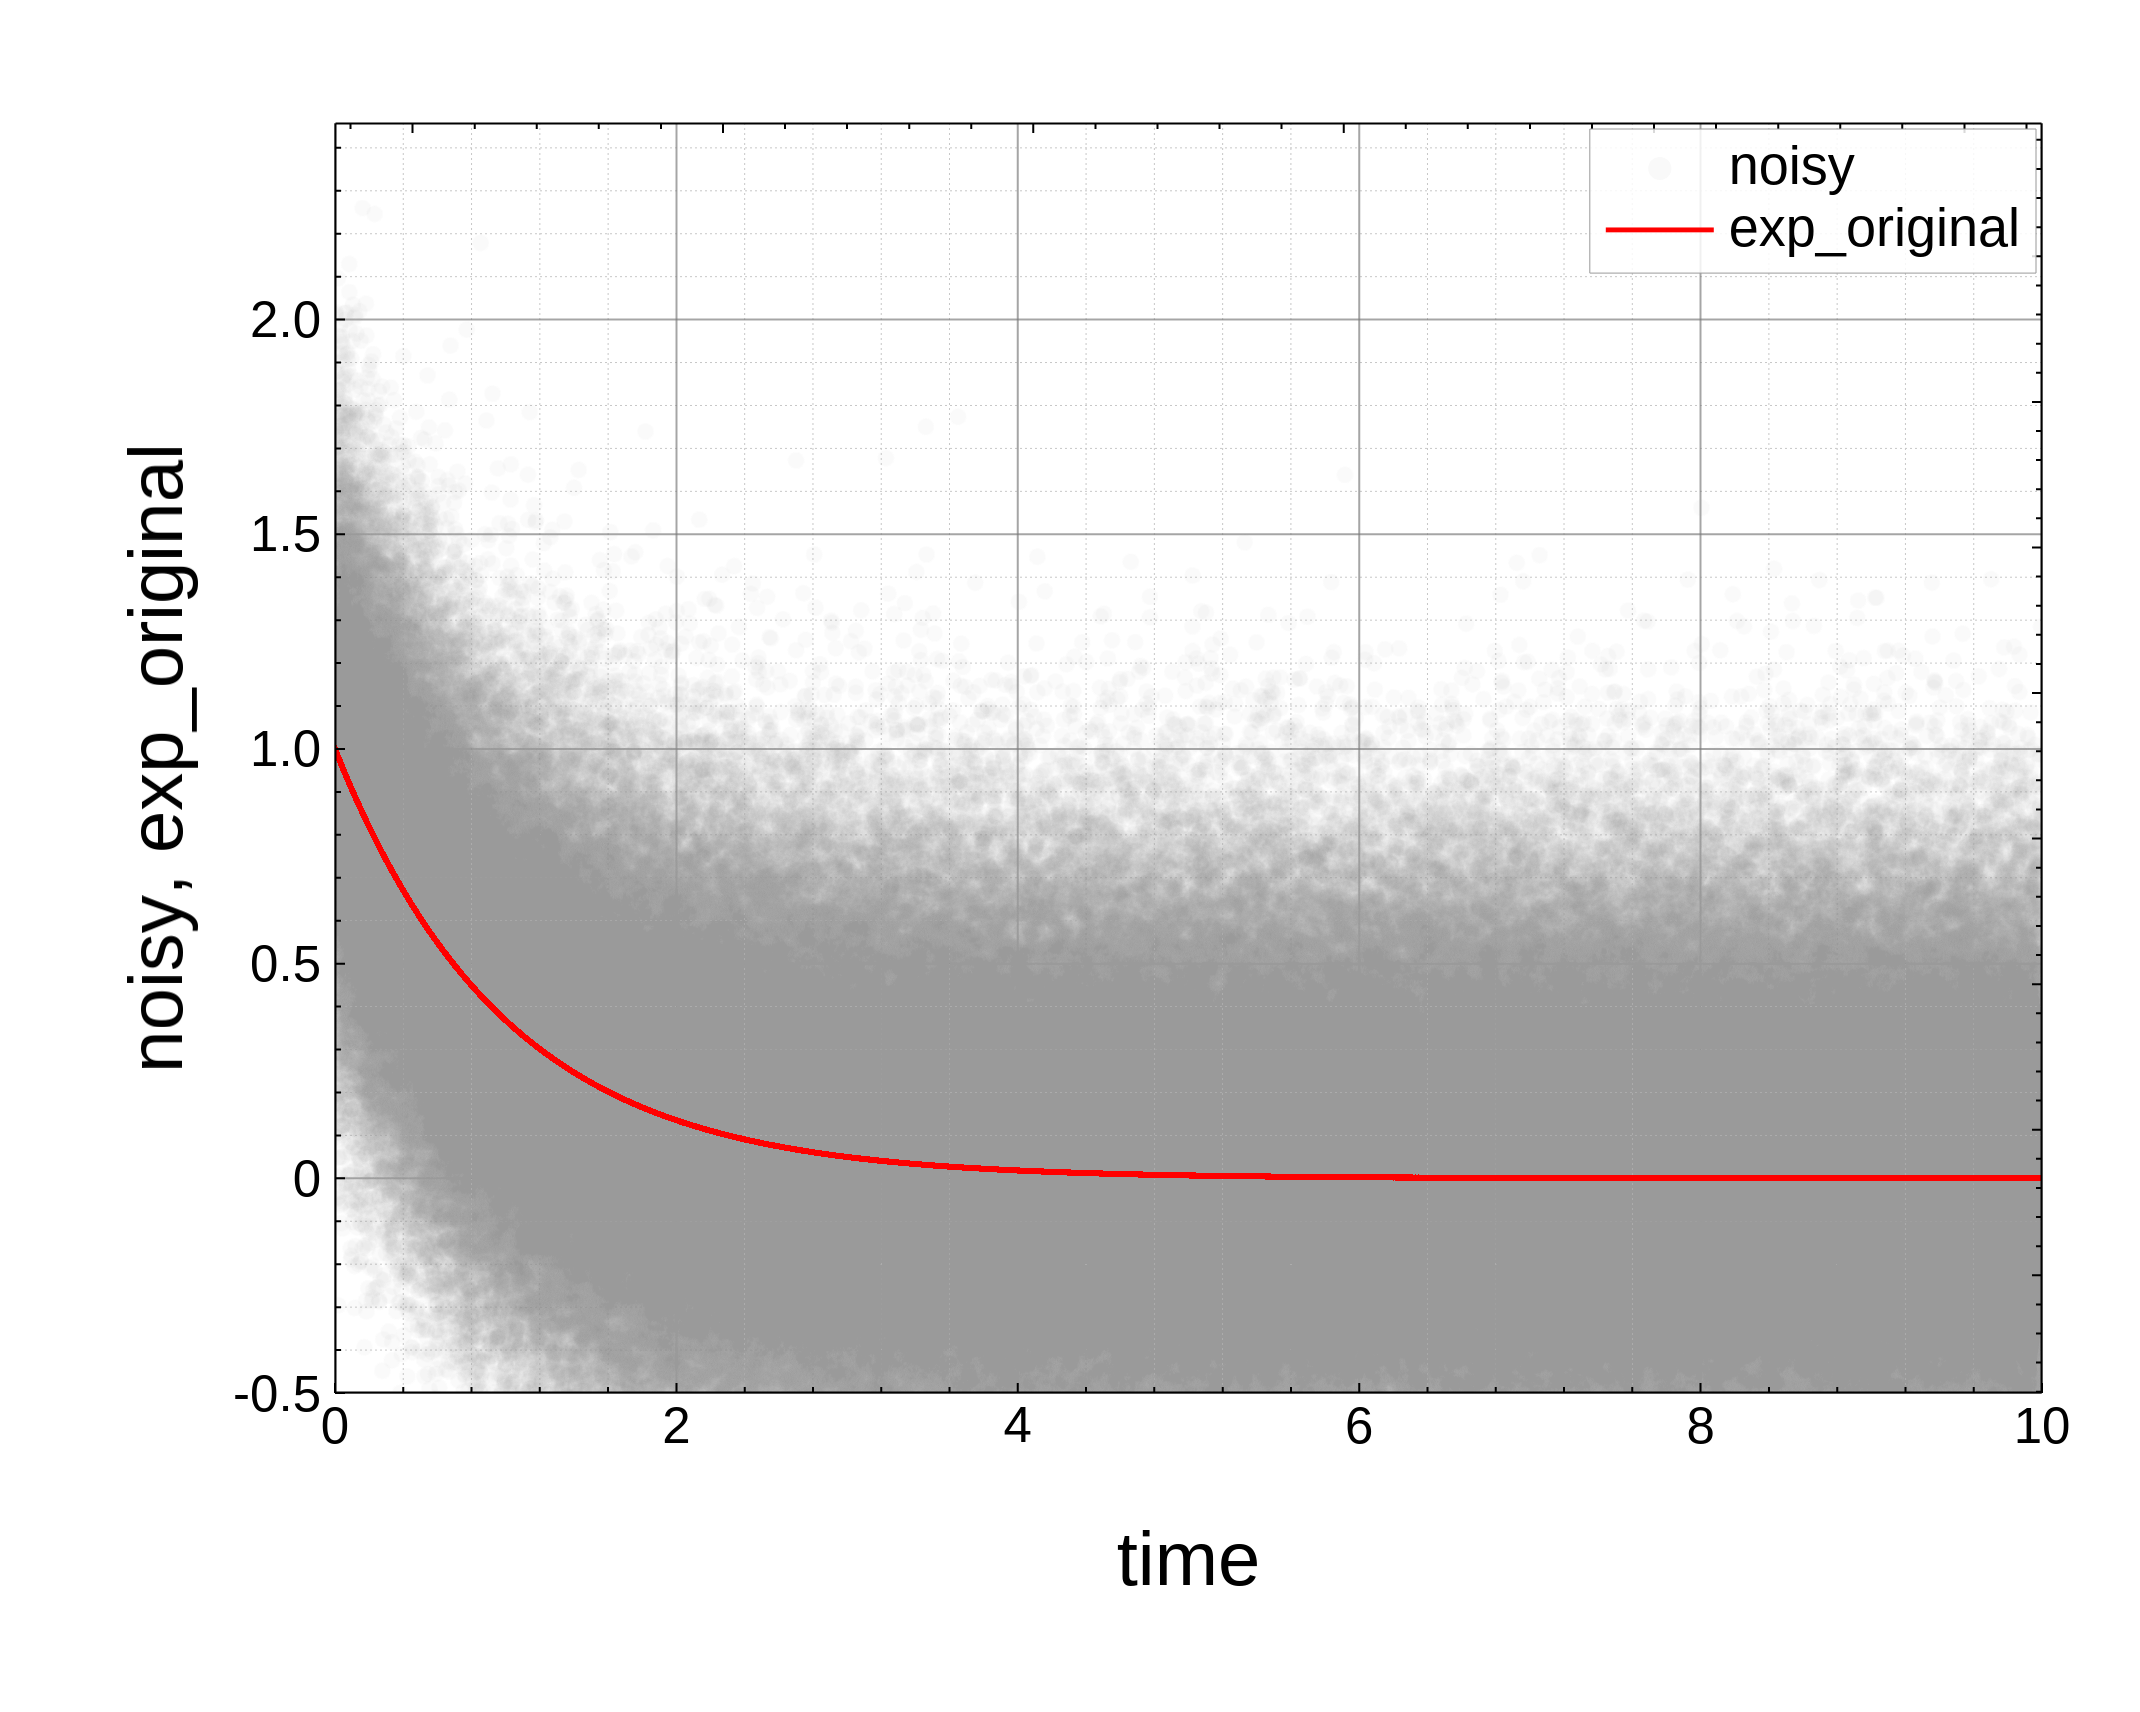
Use the studio to inspect dense scatter plots and fit lines without leaving the browser.
Then try an alternate render style if it fits the material. Free, no account, and chart data is not uploaded to figgy.
Open the studio →