A local data pipeline
Opening a CSV, TSV, or Excel file gives the browser access to the file you selected. Chart data is parsed and plotted locally; it is not uploaded to a figgy plotting service.
- 01 →Read & parse
Delimited text is read incrementally in a Worker, keeping parsing work off the interface thread.
- 02 →Store & map
Columns hold the table. You choose X, Y, and optional error or style columns.
- 03Render & inspect
Numeric arrays reach the renderer as registered columns or replayable stream sources.
The sheet uses a virtual viewport, so a large table does not create an HTML cell for every stored value. Numeric chart extraction writes into typed arrays. These choices reduce interface overhead, but the source data still occupies browser memory: streaming the GPU work does not make tab memory unlimited.
Incremental text import and bounded GPU submission are separate mechanisms. An Excel workbook follows its workbook parser's path and does not inherit every CSV streaming property.
Rust, WebAssembly, and WebGPU
The chart engine is written in Rust and compiled to WebAssembly. JavaScript manages the studio interface and supplies data; the engine owns chart configuration, range fitting, ticks, layout, hit testing, and drawing.
The renderer combines GPU work for data geometry with CPU raster work for text and chart decoration. WebGPU is accessed through wgpu. Keeping chart decisions in one engine helps the displayed figure and its exported rendering follow the same configuration.
- MODELDeclare the chart
Config, series, rich text, layout and interaction policy. This layer owns no GPU resources.
- RENDERERPrepare & draw
The chart registry, columns, GPU pipelines and CPU raster work. It owns the authoritative rendering state.
- WEBConnect the browser
Canvas, input, resize and scheduling. The studio uses the raw WASM API; a Custom Element facade is also available.
Three layers, in a deliberate order
tiny-skia and swash rasterize the grid, axes and rich text. The GPU draws data geometry between the background grid and foreground decoration, keeping the data readable.
- 01Grid
CPU-rasterized background reference lines.
- 02Data
GPU lines, points, error bars, histograms and matrix fields.
- 03Decoration
Axes, tick labels, titles and the legend above the data.
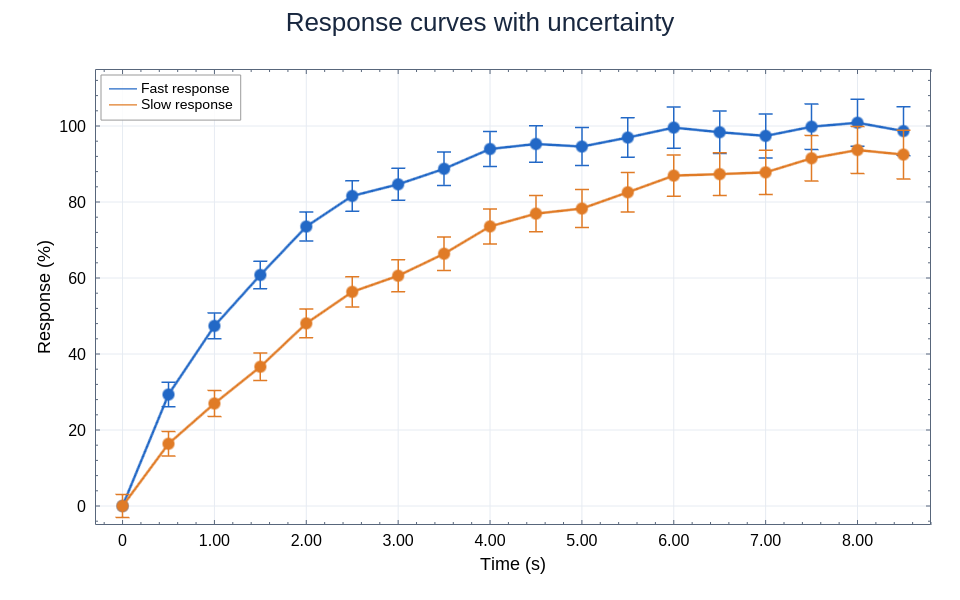
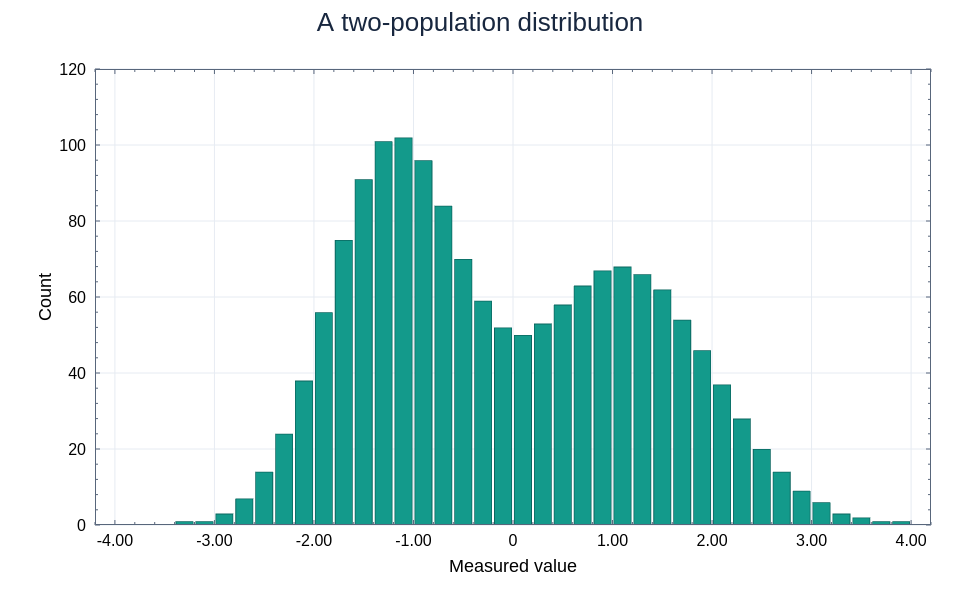
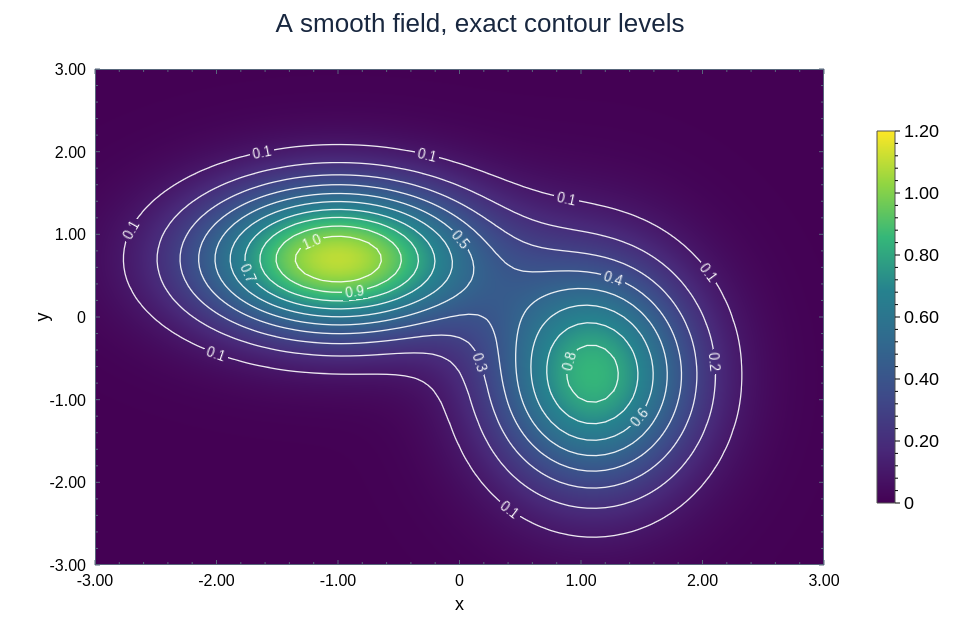
These are native renderer outputs with synthetic data, reproduced from the README gallery guide.
Configuration is the source of truth
Axes, series, labels, styles, and selected-data references belong to the renderer's configuration. After an asynchronous operation changes that configuration, the studio reads the committed result. A method returning successfully does not always mean that the GPU has finished drawing.
Redraw only what changed
The renderer issues revisions for chart state and raster changes. The browser compares them with the last successfully presented frame: an idle frame can skip drawing, a label change can refresh decoration, and a view change can request new data work. Queued resource cleanup still needs to progress while the picture is unchanged.
Explore the full architecture diagram
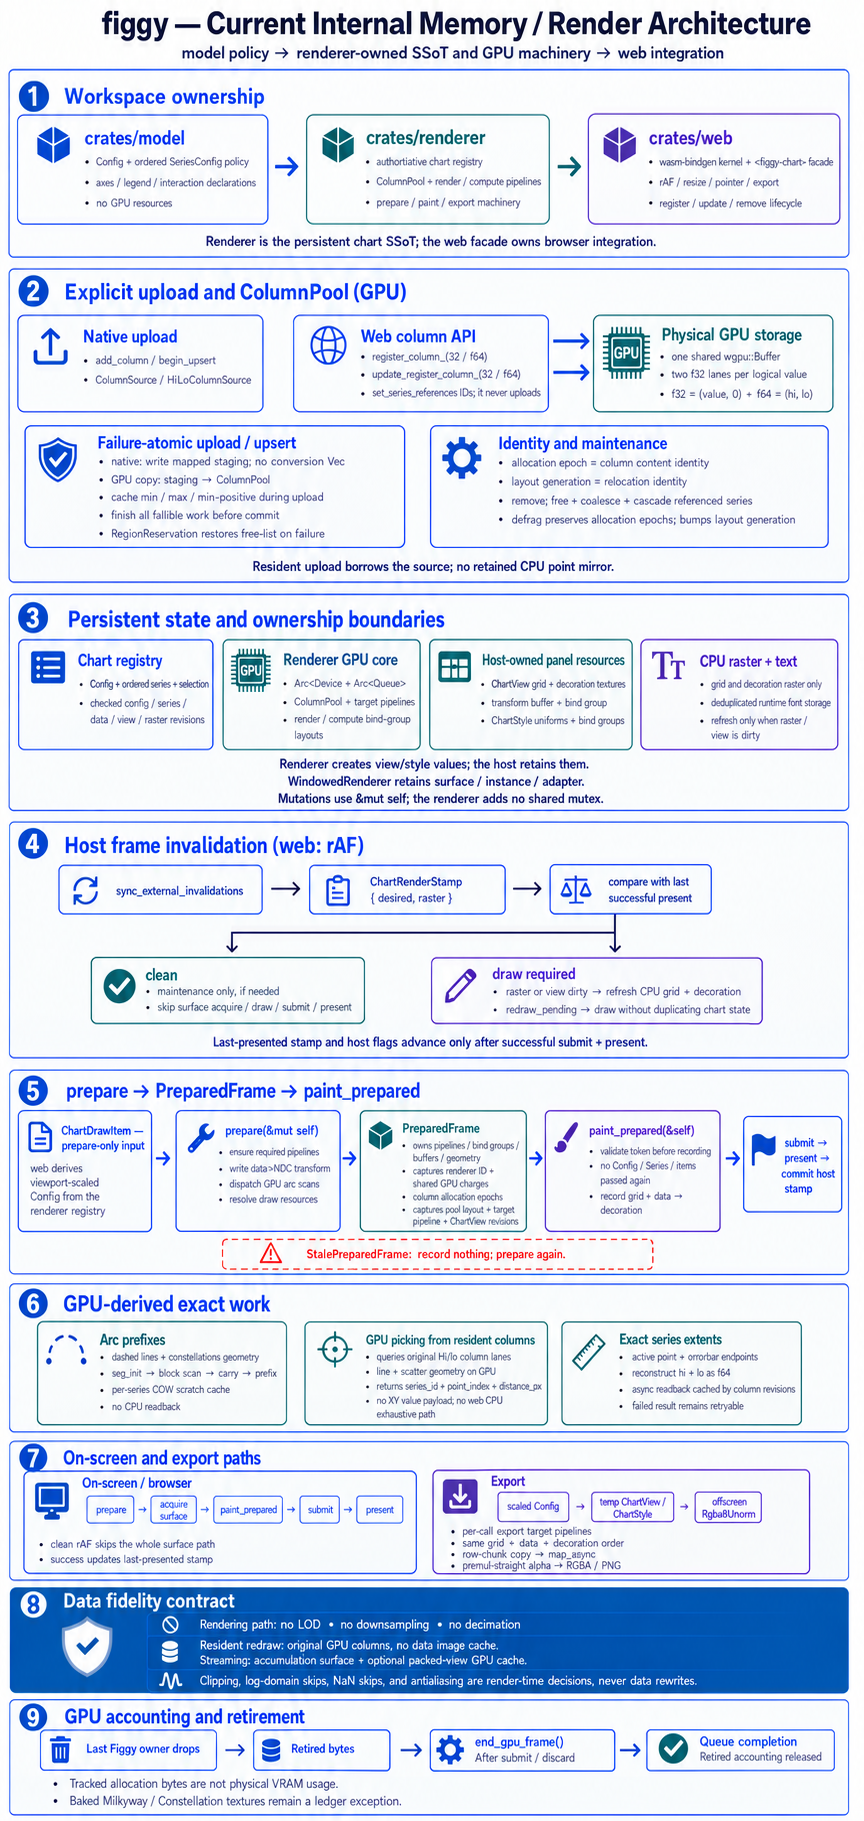
WebGPU support depends on the browser, device, driver, and adapter limits. Data editing can remain available when GPU rendering is unavailable. A successful file import alone does not prove a chart can be rendered.
One dataset. Four visual treatments.
The README uses growth-response curves to show the engine’s Precise, Sketch, Milkyway and Constellation styles. Each mode changes how the chart is drawn; the original data coordinates remain the source.
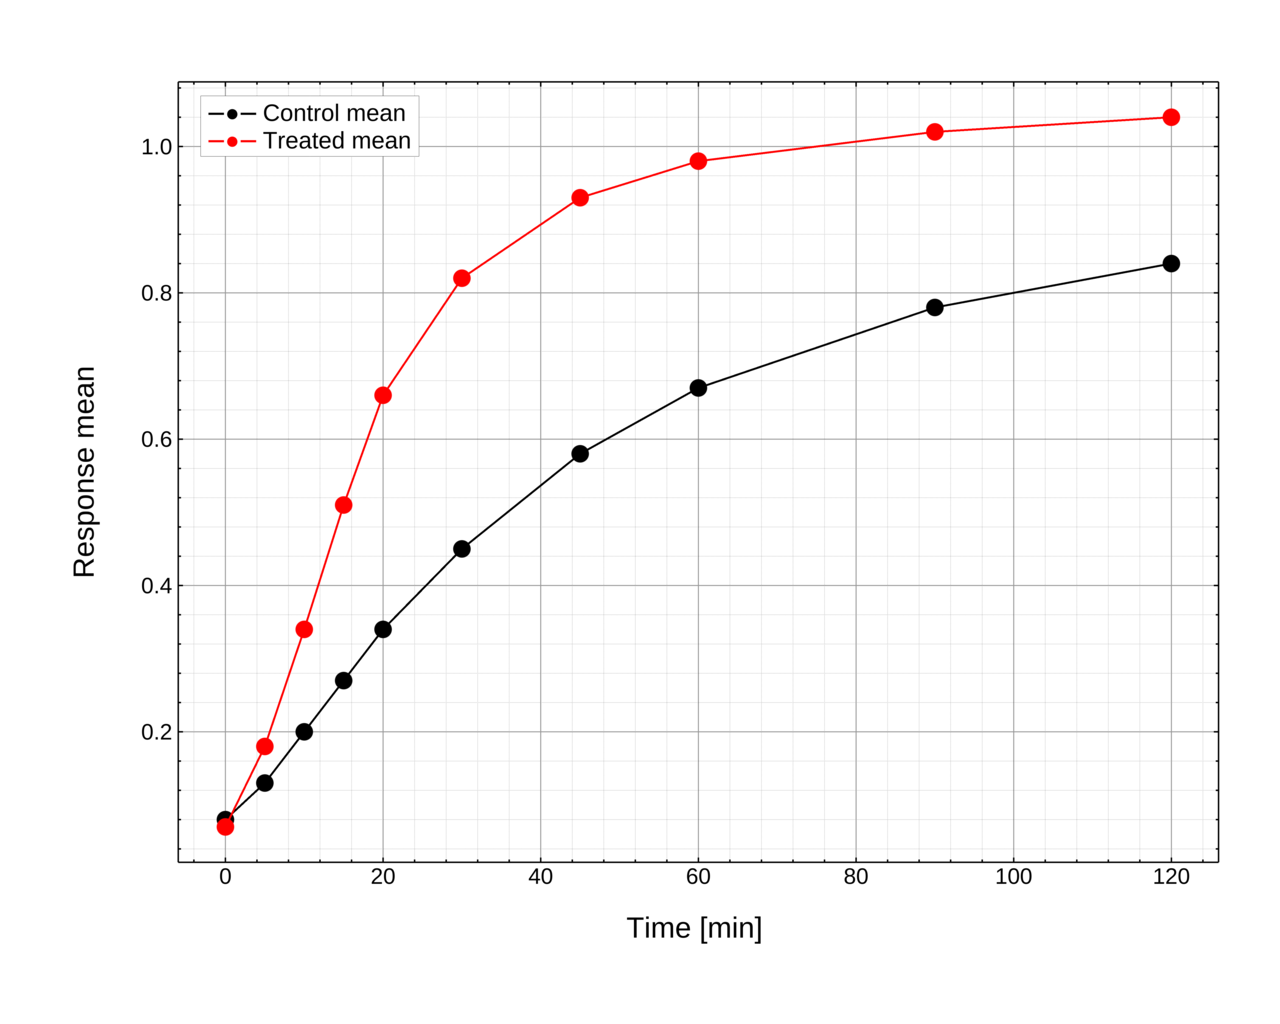
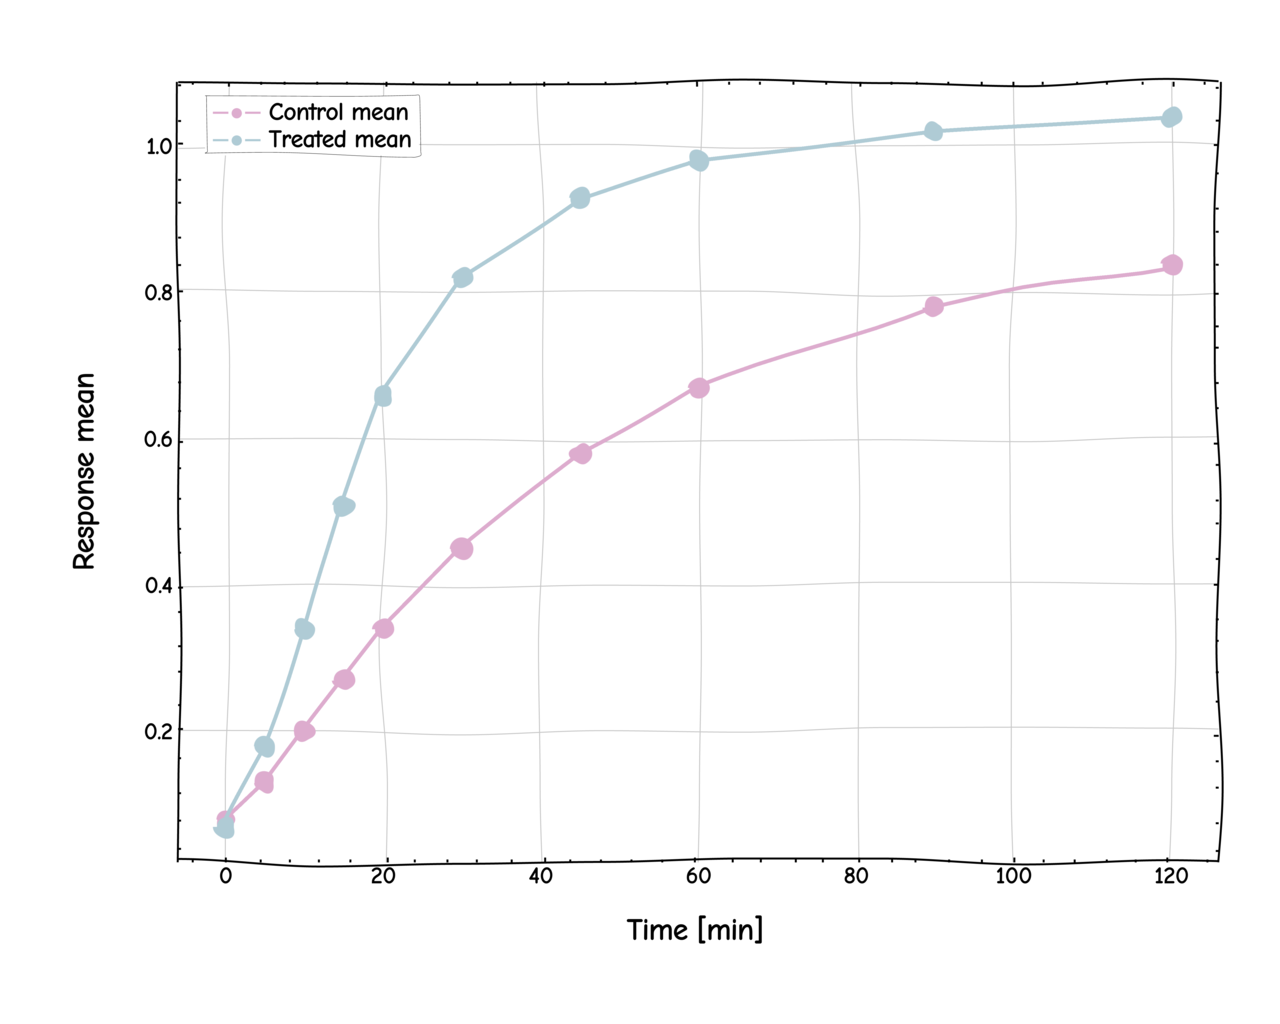
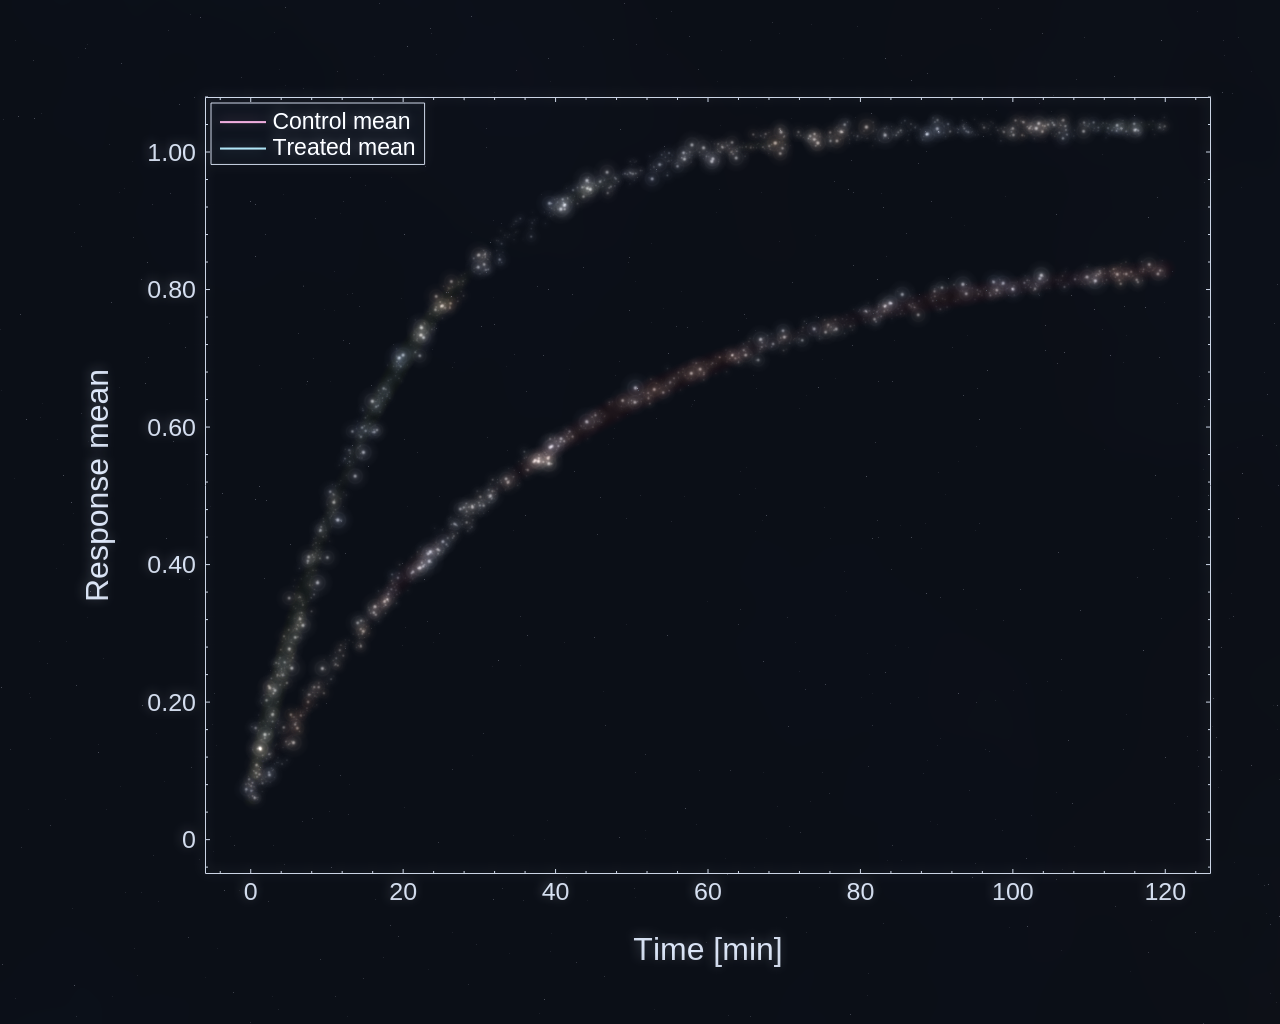
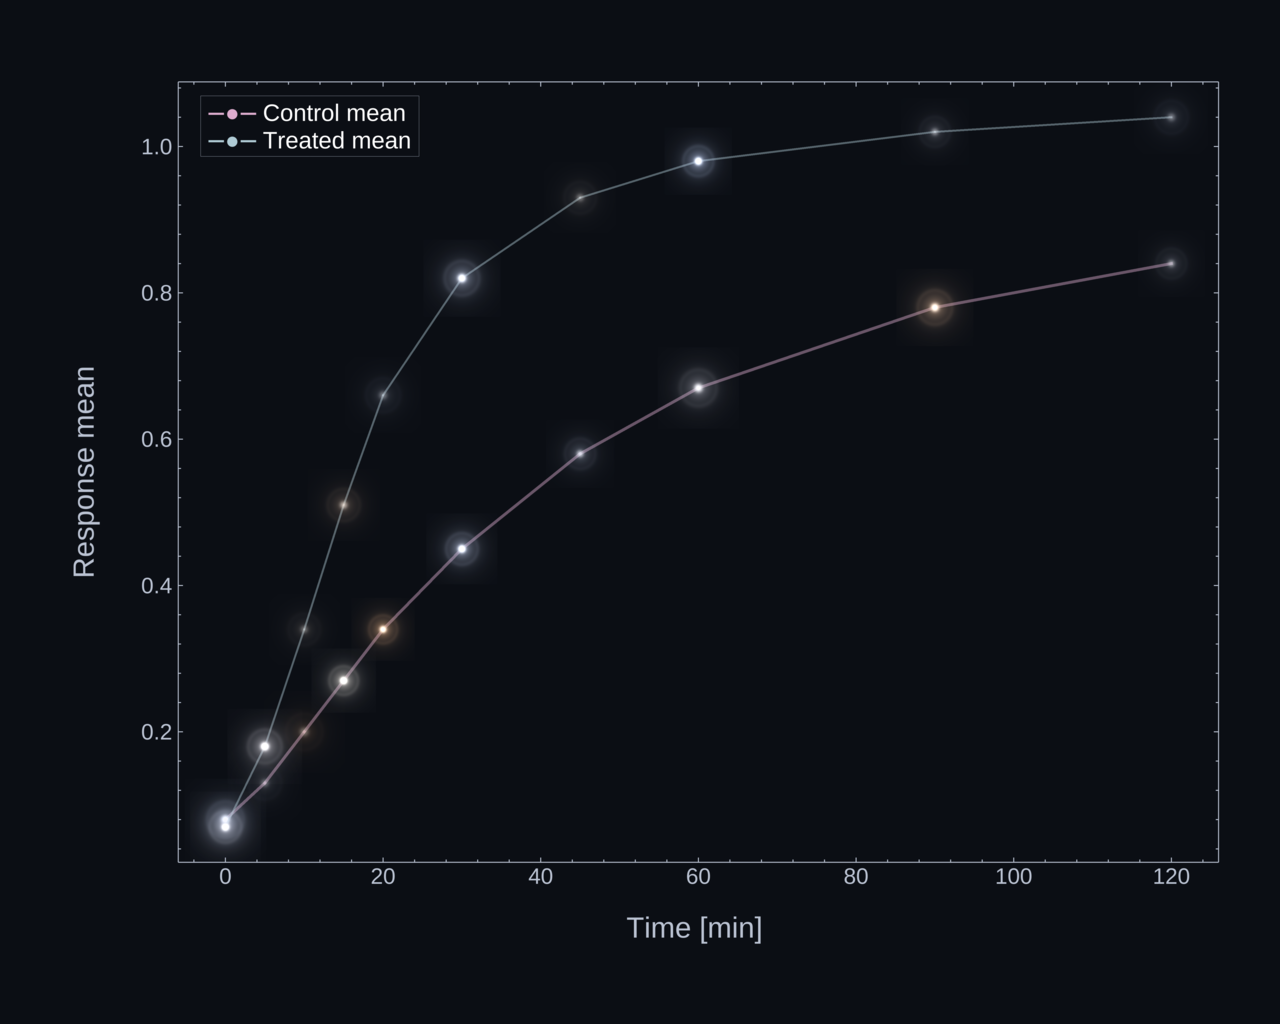
Original native renders from the README. Style and series support vary; these previews are not a claim that all four modes support streaming in the studio.
Bounded work, renderer-owned fitting
For a large chart, the renderer requests and processes bounded chunks while the browser keeps replayable source arrays. It controls draw order, temporary GPU allocations, and backpressure. The host supplies the requested data and gives the browser opportunities to process input between steps.
This path draws the source primitives without a JavaScript downsampling pass. It is a way to bound GPU work and memory, not a promise that every dataset will render instantly.
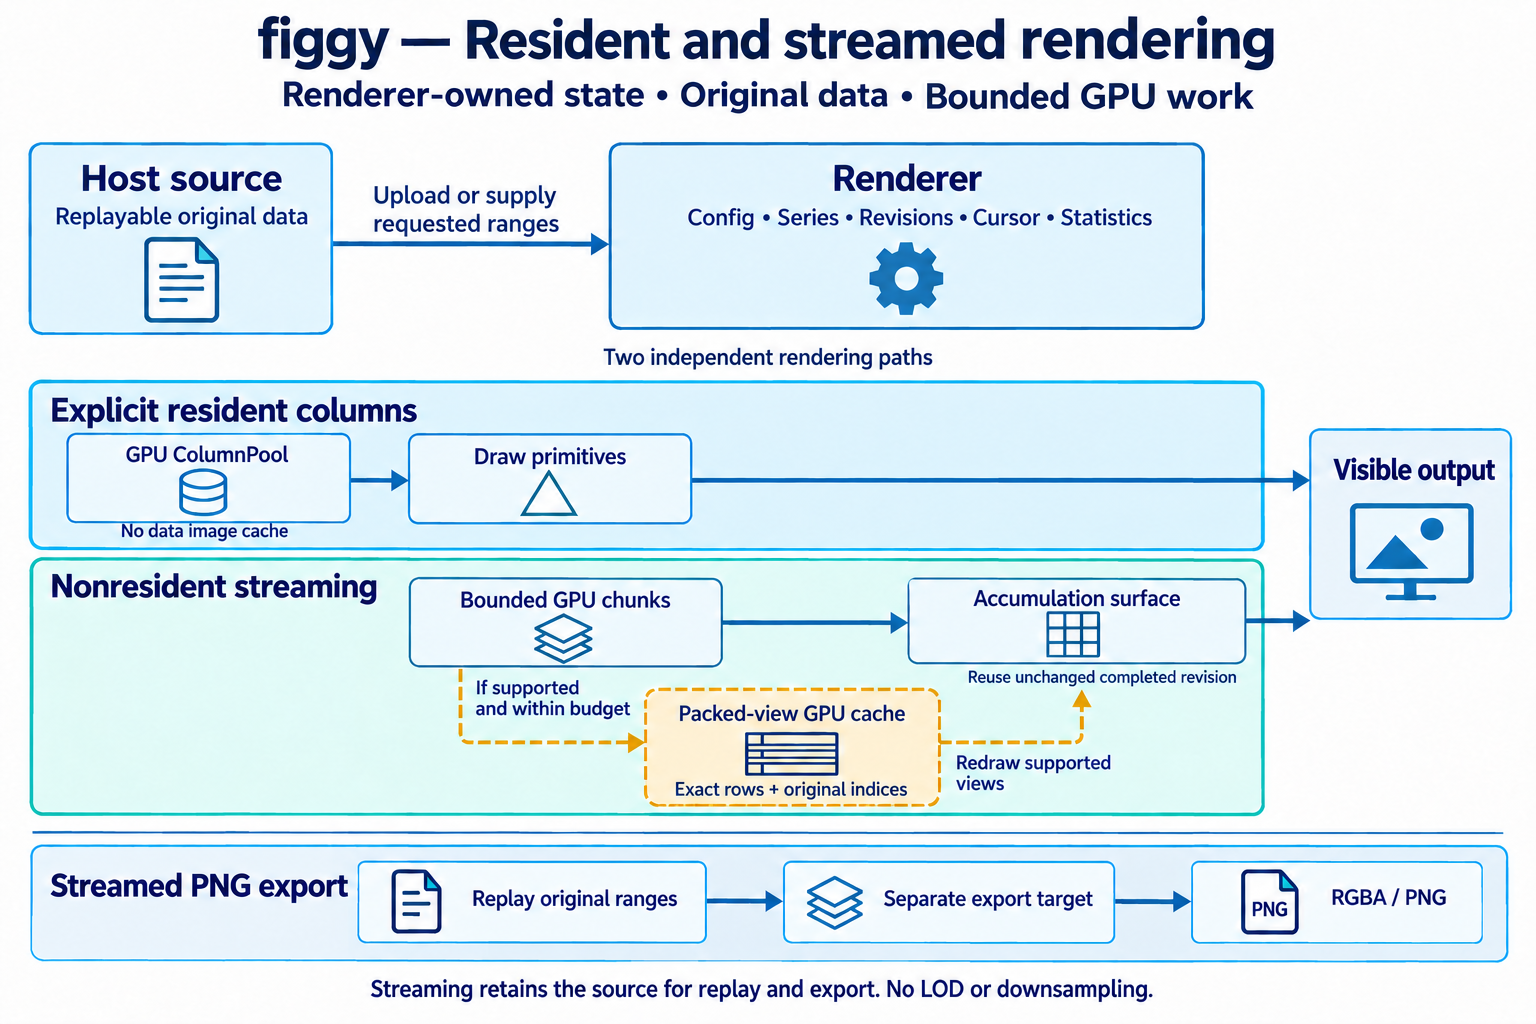
Resident drawing reads GPU columns directly. Nonresident streaming builds an accumulation surface from original chunks. An unchanged completed revision can reuse that result; changing the view or output resolution may require replaying the source. Neither path introduces LOD or decimation.
New charts and manual views have different intent
| Action | Range behavior |
|---|---|
| Create a chart | Let the engine collect complete source statistics, request fit, then render the fitted view. |
| Open a saved chart | Restore its saved ranges. Rendering does not implicitly turn fitting on. |
| Zoom or pan | Keep the range you chose and render that view. |
| Fit to all data | Explicitly request a new fit using the currently connected series and padding. |
The current release collects source statistics before fitting to avoid repeated prefix redraws. The renderer computes the range and draws the fitted view. “All submitted” means the chunks have been submitted; it does not by itself mean the final image or range is ready.
The current studio streaming path accepts supported Precise line, scatter, error-bar, and histogram configurations. Other styles and field charts have separate support constraints; importing a table does not imply that every render mode can stream it.
A large source can have a resident view
Where the complete source is stored and where the visible view is stored are different questions. The source can stay streamed while the renderer packs the rows needed for the current view into a GPU cache.
Zooming into a smaller region can make that view fit. The renderer includes dependencies such as a line crossing the viewport even when its endpoints lie outside it. Original source indices are preserved.
| State | What it means |
|---|---|
| Preparing | The renderer is building the current view's packed GPU data. |
| GPU resident | The current view is packed on the GPU and can support picking. This does not mean every source column is uploaded. |
| Streamed | The view remains streamed when packing is unsupported or exceeds a resource limit. Rendering can still complete. |
The studio currently requests a 4,000,000,000-byte overall GPU budget and a 500,000,000-byte view-cache limit. These are application limits, not measurements of free VRAM or guarantees of available memory. Device limits and allocation failures can impose tighter bounds.
Precision and lifetime have a cost
Resident logical values use two f32 lanes. Uploading f64 values splits them into high and low components, preserving large offsets such as timestamps. The shared column pool can relocate allocations during defragmentation without changing the source identity.
Releasing a chart reference does not make in-flight GPU work disappear. Live and retired allocations both remain in the renderer’s tracked total until the relevant owners and submitted work are finished. The report measures tracked requested bytes, not physical VRAM; driver allocations and some lazy Milkyway/Constellation textures are outside that total.
Whole-column admission counts unique logical values using the renderer's eight-byte resident representation. CSV file size and typed-array byte length are therefore not direct measures of the GPU allocation. Narrowing the view reduces its working set without discarding the original table.
Picking and displaying a selection
With a completed packed view, the GPU picker identifies a visible primitive and returns its original series and row reference. A view that is still preparing, or could not be packed, may not support picking yet.
Finding a hit and drawing its highlight are separate operations. Selection has its own renderer-controlled requests for the selected source rows. The studio supplies those small ranges even after the data stream has completed.
Changing or clearing a selection updates that display without restarting the entire data scan. Keeping a selection does not block zooming; view changes still pass through the renderer's normal cache and resource checks.
Editable projects and rendered figures
A .figgy project stores tables and chart configuration in a local file. Large tables use bounded binary grid blocks so the file codec can handle them in pieces. The project format belongs to the studio and is separate from the rendering engine.
Export is a new rendering target
The engine scales chart dimensions and styles, draws to an offscreen texture in the same grid → data → decoration order, and reads back aligned row chunks. It then converts premultiplied colour to straight-alpha RGBA and encodes the PNG. Chunked readback bounds the temporary buffer; the final image still needs memory.
PNG export uses an explicit scale factor. A project file preserves editable data and settings; a PNG preserves a rendered image. Save a project when you need to continue editing later.
The current public studio still restricts PNG export for raw streamed charts. A view becoming GPU resident does not automatically remove that host-side export restriction. Renderer-level capabilities and the operations exposed by the studio can differ.
Local plotting does not mean an offline website
Chart files are processed in the browser. Hosting delivers the application, fonts, and engine assets; it does not perform the chart computation.
The site can load external resources, advertising, and analytics. Sending feedback is an explicit network submission. Theme and style preferences use browser storage, while saving a project writes a file to your device. See the privacy policy for the site's data and third-party resource details.
Explore the implementation
This guide describes the public studio and its pinned renderer release. The engine's source and API documentation define the underlying contracts.
- figgy README — the primary reference for this page’s architecture, diagrams and chart previews.
- figgy-web README — studio responsibilities, the renderer boundary and local project files.
- WebAssembly API — the release used for this guide.
- Configuration and series schema — chart state definitions.
The nine illustrations on this page are unmodified documentation assets from the pinned figgy source revision. © figgy contributors, used under the MIT license. The page layout and explanatory summaries are adapted for this guide. Source releases and the online studio can run different versions.
Try it in the studio →